问题种类
时间复杂度
在集合里数据量小的情况下时间复杂度对于性能的影响看起来微乎其微。但如果某个开发的功能是一个公共功能,无法预料调用者传入数据的量时,这个复杂度的优化显得非常重要了。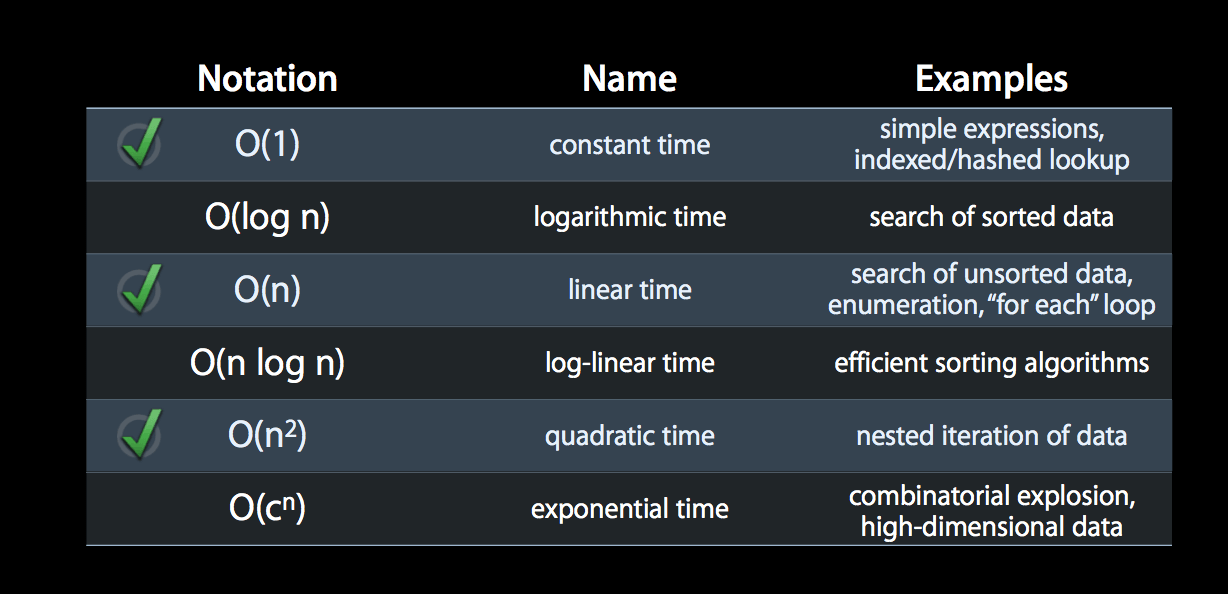
上图列出了各种情况的时间复杂度,比如高效的排序算法一般都是 O(n log n)。接下来看看下图: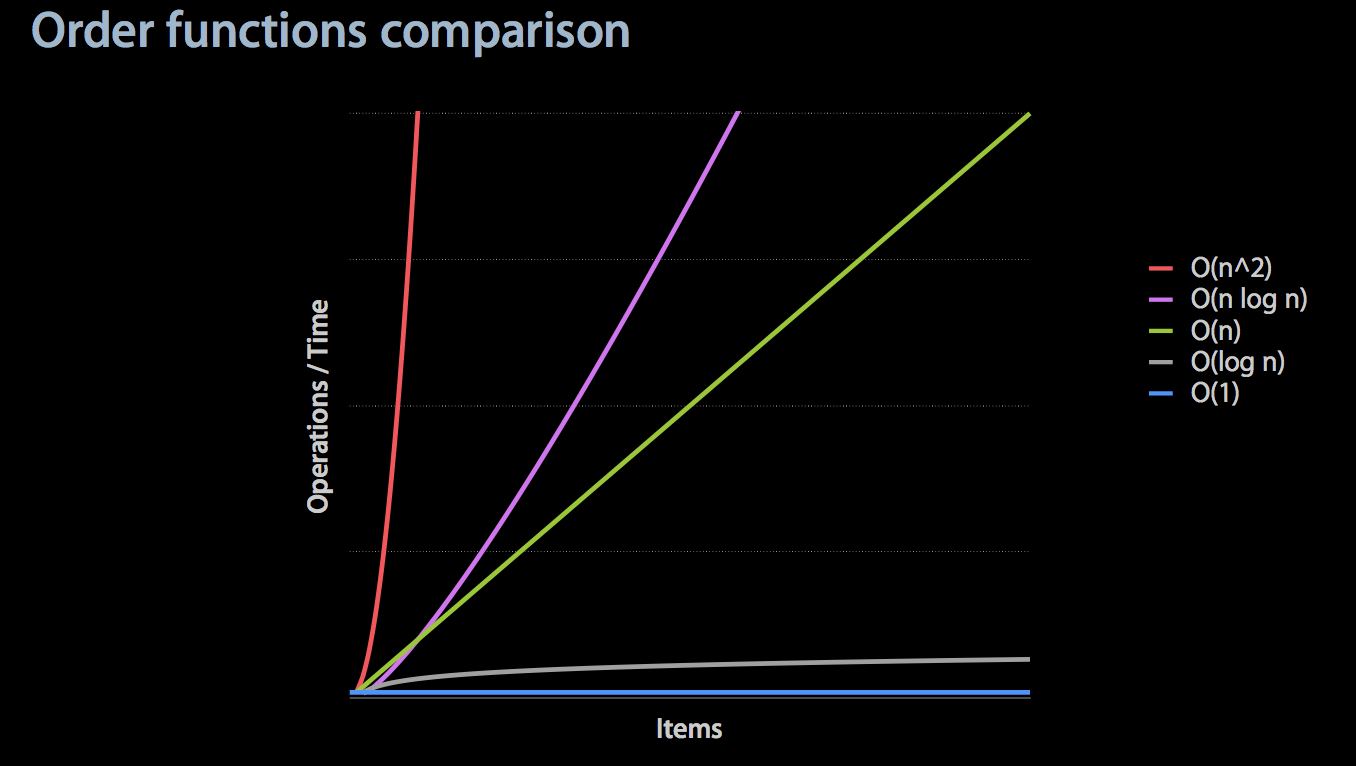
图中可以看出 O(n) 是个分水岭,大于它对于性能就具有很大的潜在影响,如果是个公共的接口一定要加上说明,自己调用也要做到心中有数。当然最好是通过算法优化或者使用合适的系统接口方法,权衡内存消耗争取通过空间来换取时间。
下面通过集合里是否有某个值来举个例子:
//O(1)
return array[idx] == value;

//O(n)
for (int i = 0; i < count; i++) {
    if (array[i] == value) {
        return YES;
    }
}
return NO;

//O(n2) 找重复的值
for (int i = 0; i < count; i++) {
    for (int j = 0; j < count; j++) {
        if ( i != j && array[i] == array[j]) {
            return YES;
        }
    }
}
return NO;
那么 OC 里几种常用集合对象提供的接口方法时间复杂度是怎么样的。
NSArray / NSMutableArray
首先我们发现他们是有排序,并允许重复元素存在的,那么这么设计就表明了集合存储没法使用里面的元素做 hash table 的 key 进行相关的快速操作,。所以不同功能接口方法性能是会有很大的差异。
- containsObject:,containsObject:,indexOfObject*,removeObject: 会遍历里面元素查看是否与之匹对,所以复杂度等于或大于 O(n)
- objectAtIndex:,firstObject:,lastObject:,addObject:,removeLastObject: 这些只针对栈顶栈底操作的时间复杂度都是 O(1)
- indexOfObject:inSortedRange:options:usingComparator: 使用的是二分查找,时间复杂度是 O(log n)
NSSet / NSMutableSet / NSCountedSet
这些集合类型是无序没有重复元素。这样就可以通过 hash table 进行快速的操作。比如 addObject:, removeObject:, containsObject: 都是按照 O(1) 来的。需要注意的是将数组转成 Set 时会将重复元素合成一个,同时失去排序。
NSDictionary / NSMutableDictionary
和 Set 差不多,多了键值对应。添加删除和查找都是 O(1) 的。需要注意的是 Keys 必须是符合 NSCopying。
containsObject 方法在数组和 Set 里不同的实现
在数组中的实现
- (BOOL) containsObject: (id)anObject
{
  return ([self indexOfObject: anObject] != NSNotFound);
}
- (NSUInteger) indexOfObject: (id)anObject
{
  unsigned	c = [self count];

  if (c > 0 && anObject != nil)
    {
      unsigned	i;
      IMP	get = [self methodForSelector: oaiSel];
      BOOL	(*eq)(id, SEL, id)
	= (BOOL (*)(id, SEL, id))[anObject methodForSelector: eqSel];

      for (i = 0; i < c; i++)
	if ((*eq)(anObject, eqSel, (*get)(self, oaiSel, i)) == YES)
	  return i;
    }
  return NSNotFound;
}
可以看到会遍历所有元素在查找到后才进行返回.
接下来可以看看 containsObject 在 Set 里的实现:
- (BOOL) containsObject: (id)anObject
{
  return (([self member: anObject]) ? YES : NO);
}
//在 GSSet,m 里有对 member 的实现
- (id) member: (id)anObject
{
  if (anObject != nil)
    {
      GSIMapNode node = GSIMapNodeForKey(&map, (GSIMapKey)anObject);
      if (node != 0)
	{
	  return node->key.obj;
	}
    }
  return nil;
}
找元素时是通过键值方式从 map 映射表里取出,因为 Set 里元素是唯一的,所以可以 hash 元素对象作为 key 达到快速获取值的目的。
用 GCD 来做优化
我们可以通过 GCD 提供的方法来将一些需要耗时操作放到非主线程上做,使得 App 能够运行的更加流畅响应更快。但是使用 GCD 时需要注意避免可能引起线程爆炸和死锁的情况,还有非主线程处理任务也不是万能的,如果一个处理需要消耗大量内存或者大量CPU操作 GCD 也没法帮你,只能通过将处理进行拆解分步骤分时间进行处理才比较妥当。
异步处理事件
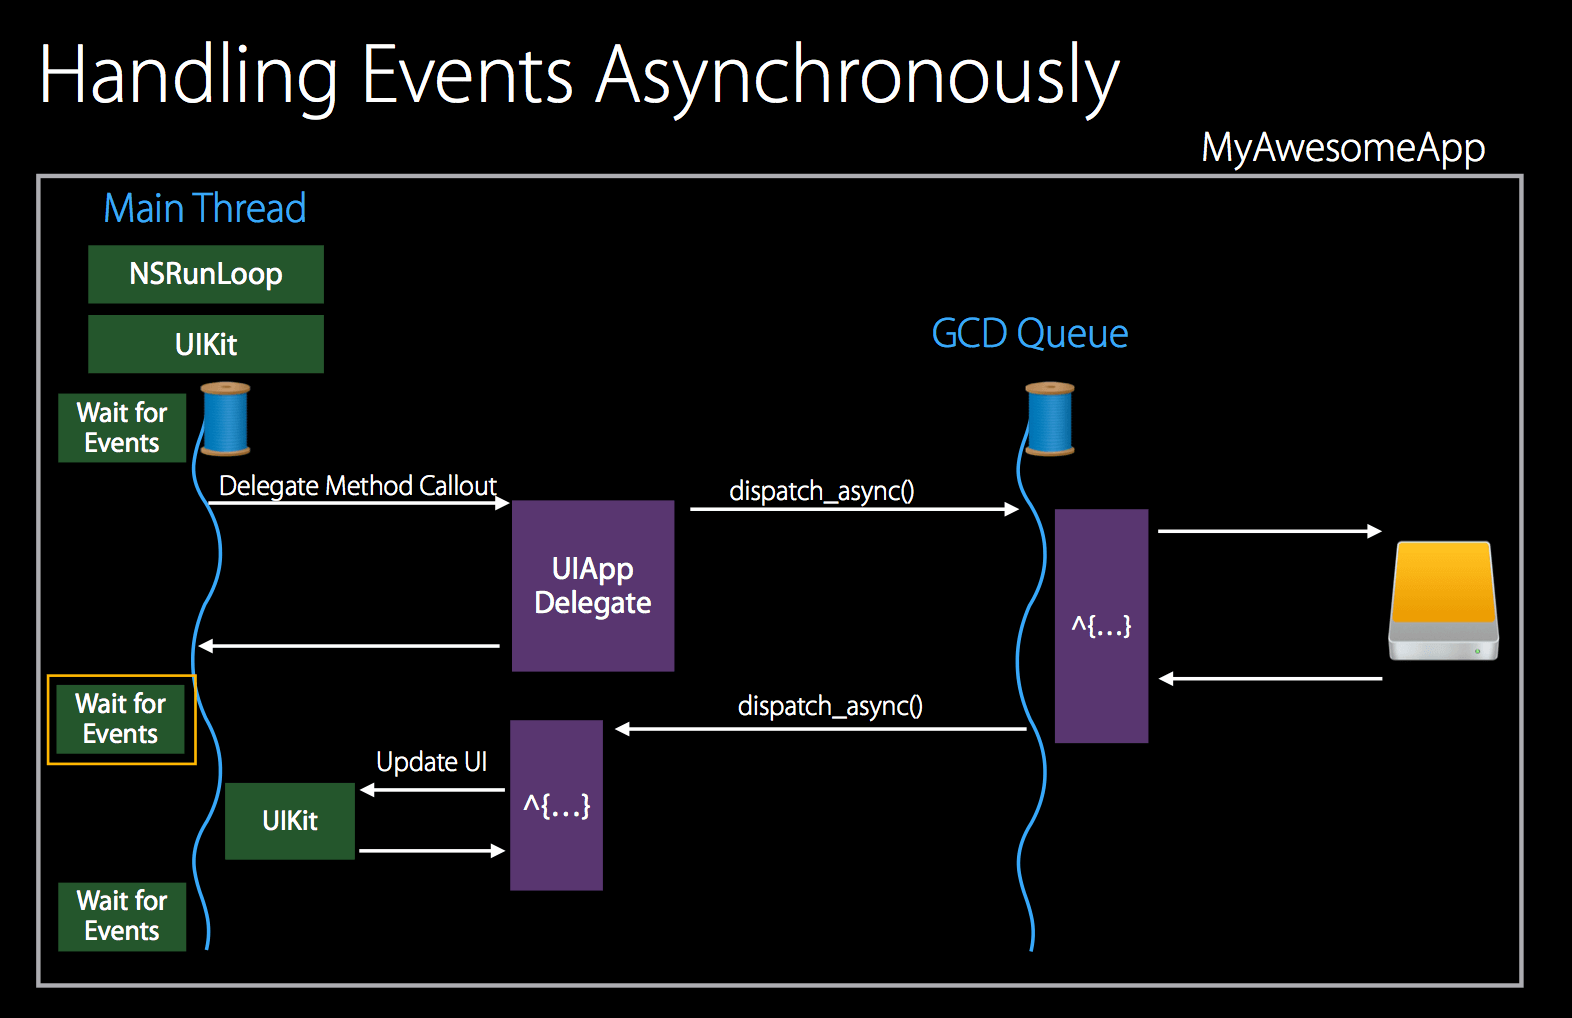
上图是最典型的异步处理事件的方法
需要耗时长的任务
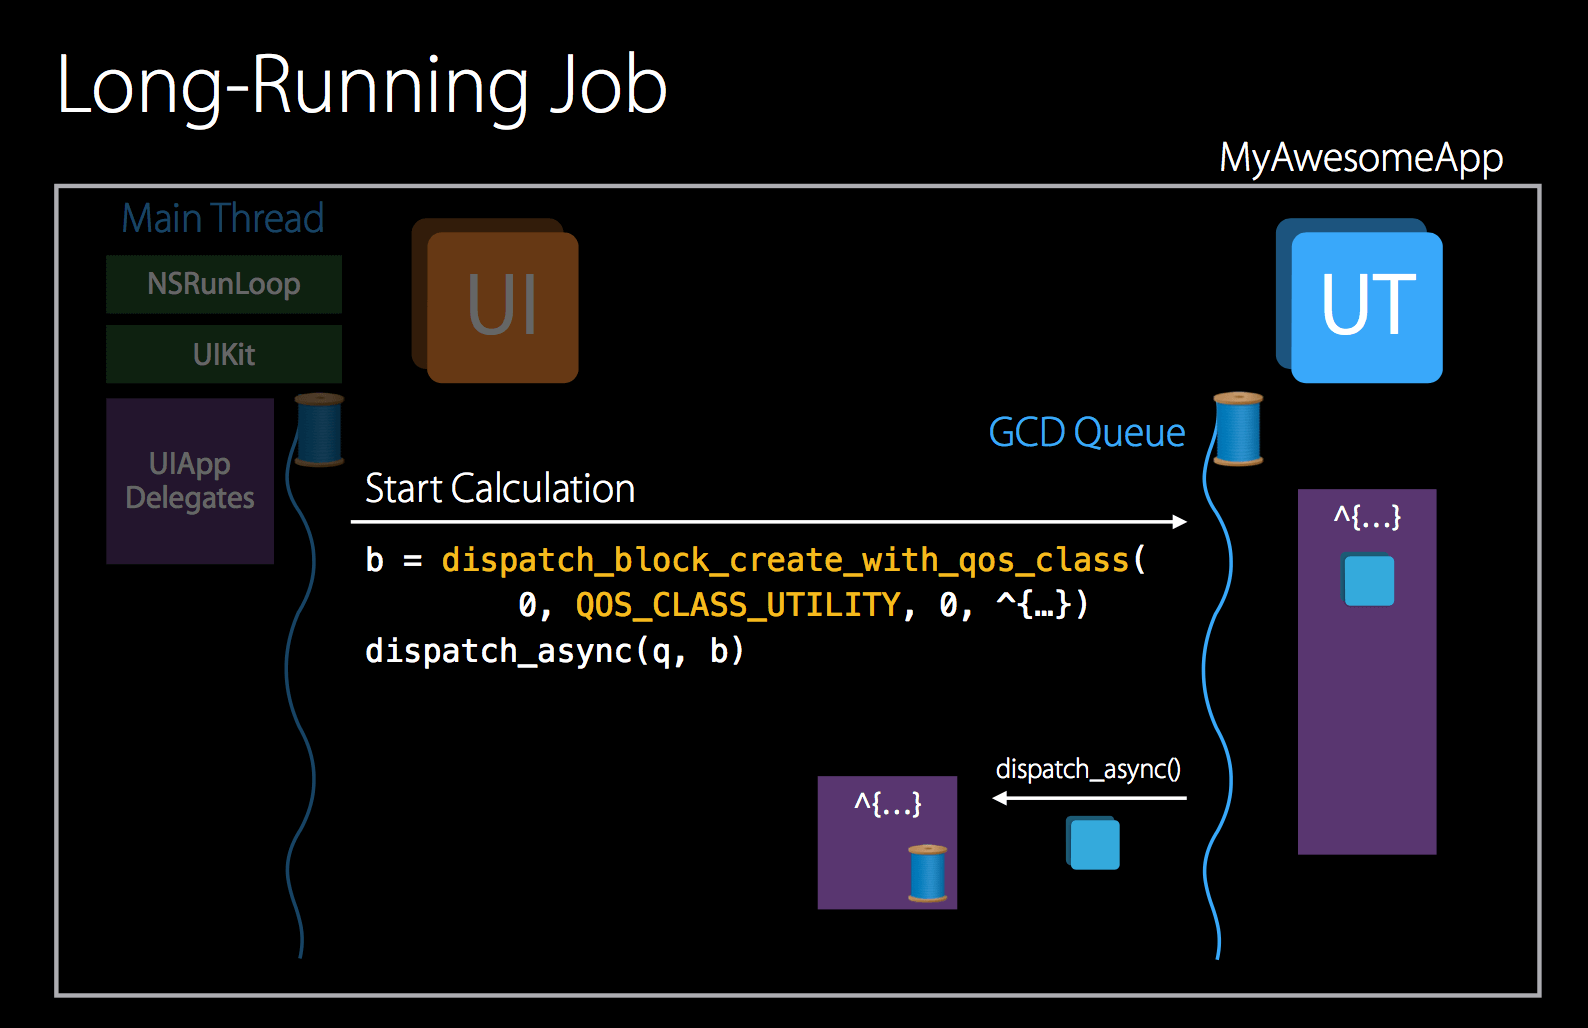
将 GCD 的 block 通过 dispatch_block_create_with_qos_class 方法指定队列的 QoS 为 QOS_CLASS_UTILITY。这种 QoS 系统会针对大的计算,I/O,网络以及复杂数据处理做电量优化。
避免线程爆炸
- 使用串行队列
- 使用 NSOperationQueues 的并发限制方法 NSOperationQueue.maxConcurrentOperationCount
举个例子,下面的写法就比较危险,可能会造成线程爆炸和死锁
for (int i = 0; i < 999; i++) {
    dispatch_async(q, ^{...});
}
dispatch_barrier_sync(q, ^{});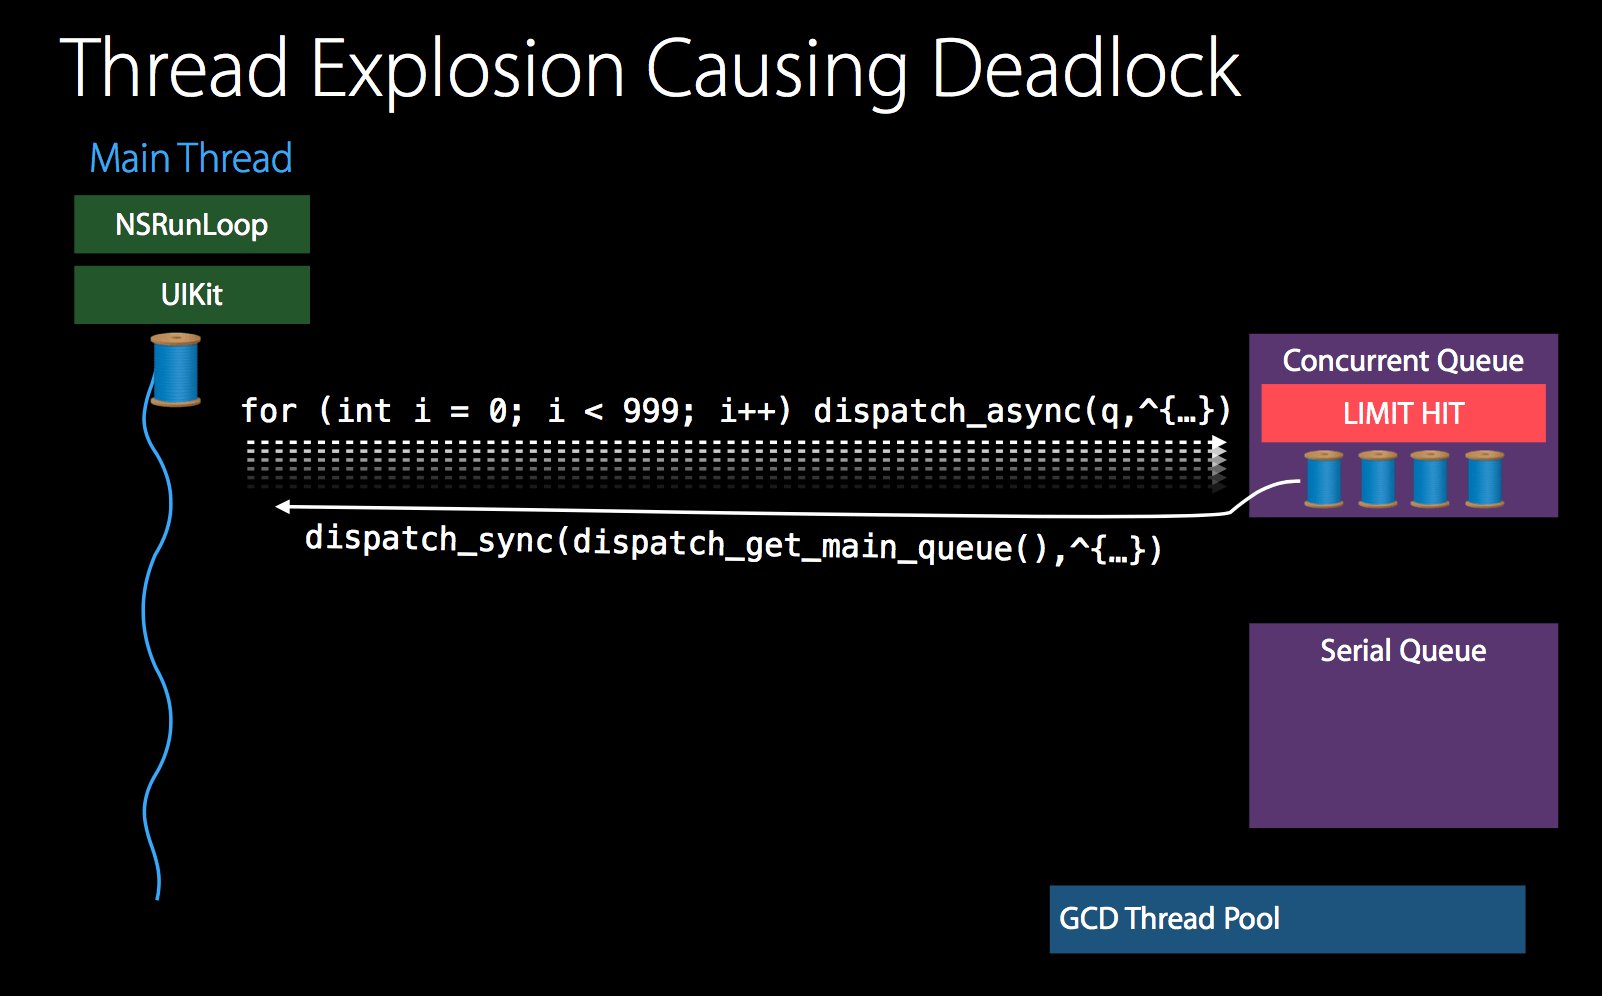
那么怎么能够避免呢?首先可以使用 dispatch_apply
dispatch_apply(999, q, ^(size_t i){...});或者使用 dispatch_semaphore
#define CONCURRENT_TASKS 4
sema = dispatch_semaphore_create(CONCURRENT_TASKS);
for (int i = 0; i < 999; i++){
    dispatch_async(q, ^{
        dispatch_semaphore_signal(sema);
    });
    dispatch_semaphore_wait(sema, DISPATCH_TIME_FOREVER);
}
GCD 相关 Crash 日志
管理线程问题
Thread 1:: Dispatch queue: com.apple.libdispatch-manager
0   libsystem_kernel.dylib   0x00007fff8967e08a kevent_qos + 10
1   libdispatch.dylib        0x00007fff8be05811 _dispatch_mgr_invoke + 251
2   libdispatch.dylib        0x00007fff8be05465 _dispatch_mgr_thread + 52
线程闲置时
Thread 6:
0   libsystem_kernel.dylib       0x00007fff8967d772 __workq_kernreturn + 10
1   libsystem_pthread.dylib      0x00007fff8fd317d9 _pthread_wqthread + 1283
2   libsystem_pthread.dylib      0x00007fff8fd2ed95 start_wqthread + 13
线程活跃时
Thread 3 Crashed:: Dispatch queue: <queue name>
<my code>
7   libdispatch.dylib        0x07fff8fcfd323 _dispatch_call_block_and_release
8   libdispatch.dylib        0x07fff8fcf8c13 _dispatch_client_callout + 8
9   libdispatch.dylib        0x07fff8fcfc365 _dispatch_queue_drain + 1100
10  libdispatch.dylib        0x07fff8fcfdecc _dispatch_queue_invoke + 202
11  libdispatch.dylib        0x07fff8fcfb6b7 _dispatch_root_queue_drain + 463
12  libdispatch.dylib        0x07fff8fd09fe4 _dispatch_worker_thread3 + 91
13  libsystem_pthread.dylib  0x07fff93c17637 _pthread_wqthread + 729
14  libsystem_pthread.dylib  0x07fff93c1540d start_wqthread + 13
主线程闲置时
Thread 0 Crashed:: Dispatch queue: com.apple.main-thread
0   libsystem_kernel.dylib     0x00007fff906614de mach_msg_trap + 10
1   libsystem_kernel.dylib     0x00007fff9066064f mach_msg + 55
2   com.apple.CoreFoundation   0x00007fff9a8c1eb4 __CFRunLoopServiceMachPort
3   com.apple.CoreFoundation   0x00007fff9a8c137b __CFRunLoopRun + 1371
4   com.apple.CoreFoundation   0x00007fff9a8c0bd8 CFRunLoopRunSpecific + 296
...
10  com.apple.AppKit           0x00007fff8e823c03 -[NSApplication run] + 594
11  com.apple.AppKit           0x00007fff8e7a0354 NSApplicationMain + 1832
12  com.example                0x00000001000013b4 start + 52
主队列
Thread 0 Crashed:: Dispatch queue: com.apple.main-thread
<my code>
12  com.apple.Foundation      0x00007fff931157e8 __NSBLOCKOPERATION_IS_CALLING_OUT_TO_A_BLOCK__ + 7
13  com.apple.Foundation      0x00007fff931155b5 -[NSBlockOperation main] + 9
14  com.apple.Foundation      0x00007fff93114a6c -[__NSOperationInternal _start:] + 653
15  com.apple.Foundation      0x00007fff93114543 __NSOQSchedule_f + 184
16  libdispatch.dylib         0x00007fff935d6c13 _dispatch_client_callout + 8
17  libdispatch.dylib         0x00007fff935e2cbf _dispatch_main_queue_callback_4CF + 861
18  com.apple.CoreFoundation  0x00007fff8d9223f9 __CFRUNLOOP_IS_SERVICING_THE_MAIN_DISPATCH_QUEUE__
19  com.apple.CoreFoundation  0x00007fff8d8dd68f __CFRunLoopRun + 2159
20  com.apple.CoreFoundation  0x00007fff8d8dcbd8 CFRunLoopRunSpecific + 296
...
26  com.apple.AppKit          0x00007fff999a1bd3 -[NSApplication run] + 594
27  com.apple.AppKit          0x00007fff9991e324 NSApplicationMain + 1832
28  libdyld.dylib             0x00007fff9480f5c9 start + 1
I/O 性能优化
I/O 是性能消耗大户,任何的 I/O 操作都会使低功耗状态被打破,所以减少 I/O 次数是这个性能优化的关键点,为了达成这个目下面列出一些方法。
- 将零碎的内容作为一个整体进行写入
- 使用合适的 I/O 操作 API
- 使用合适的线程
- 使用 NSCache 做缓存能够减少 I/O
NSCache
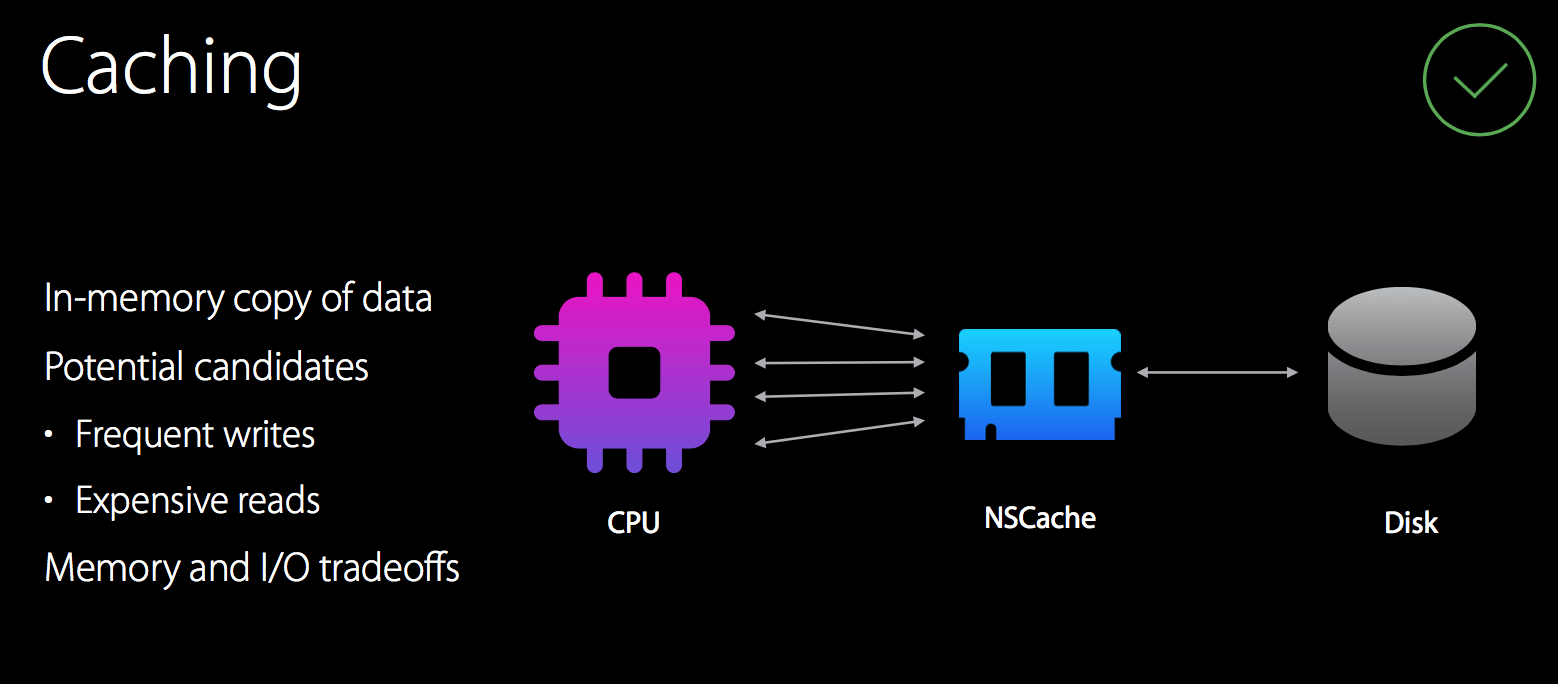
达到如图的目的为何不直接用字典来做呢?
NSCache 具有字典的所有功能,同时还有如下的特性:
- 自动清理系统占用内存
- NSCache 是线程安全
- -(void)cache:(NSCache *)cache willEvictObject:(id)obj; 缓存对象将被清理时的回调
- evictsObjectsWithDiscardedContent 可以控制是否清理
那么 NSCache是如何做到这些特性的呢?
接下来学习下 NSCache 是如何做的。首先 NSCache 是会持有一个 NSMutableDictionary。
@implementation NSCache
- (id) init
{
  if (nil == (self = [super init]))
    {
      return nil;
    }
  _objects = [NSMutableDictionary new];
  _accesses = [NSMutableArray new];
  return self;
}
需要设计一个 Cached 对象结构来保存一些额外的信息
@interface _GSCachedObject : NSObject
{
  @public
  id object; //cache 的值
  NSString *key; //设置 cache 的 key
  int accessCount; //保存访问次数,用于自动清理
  NSUInteger cost; //setObject:forKey:cost:
  BOOL isEvictable; //线程安全
}
@end
在 Cache 读取的时候会对 _accesses 数组的添加删除通过 isEvictable 布尔值来保证线程安全操作。使用 Cached 对象里的 accessCount 属性进行 +1 操作为后面自动清理的条件判断做准备。具体实现如下:
- (id) objectForKey: (id)key
{
  _GSCachedObject *obj = [_objects objectForKey: key];
  if (nil == obj)
    {
      return nil;
    }
  if (obj->isEvictable) //保证添加删除操作线程安全
    {
      // 将 obj 移到 access list 末端
      [_accesses removeObjectIdenticalTo: obj];
      [_accesses addObject: obj];
    }
  obj->accessCount++;
  _totalAccesses++;
  return obj->object;
}
在每次 Cache 添加时会先去检查是否自动清理,会创建一个 Cached 对象将 key,object,cost 等信息记录下添加到 _accesses 数组和 _objects 字典里。
- (void) setObject: (id)obj forKey: (id)key cost: (NSUInteger)num
{
  _GSCachedObject *oldObject = [_objects objectForKey: key];
  _GSCachedObject *newObject;

  if (nil != oldObject)
    {
      [self removeObjectForKey: oldObject->key];
    }
  [self _evictObjectsToMakeSpaceForObjectWithCost: num];
  newObject = [_GSCachedObject new];
  // Retained here, released when obj is dealloc'd
  newObject->object = RETAIN(obj);
  newObject->key = RETAIN(key);
  newObject->cost = num;
  if ([obj conformsToProtocol: @protocol(NSDiscardableContent)])
    {
      newObject->isEvictable = YES;
      [_accesses addObject: newObject];
    }
  [_objects setObject: newObject forKey: key];
  RELEASE(newObject);
  _totalCost += num;
}
那么上面提到的自动清理内存的方法是如何实现的呢?
既然是自动清理必定需要有触发时机和进入清理的条件判断,触发时机一个是发生在添加 Cache 内容时,一个是发生在内存警告时。条件判断代码如下:
// cost 在添加新 cache 值时指定的 cost
// _costLimit 是 totalCostLimit 属性值
if (_costLimit > 0 && _totalCost + cost > _costLimit){
	spaceNeeded = _totalCost + cost - _costLimit;
}
// 只有当 cost 大于人工限制时才会清理
// 或者 cost 设置为0不进行人工干预
if (count > 0 && (spaceNeeded > 0 || count >= _countLimit))
所以 NSCache 的 totalCostLimit 的值会和每次 Cache 添加的 cost 之和对比,超出限制必然触发内存清理。
清理时会对经常访问的 objects 不清理,主要是通过 _totalAccesses 和总数获得平均访问频率,如果那个对象的访问次数是小于平均值的才需要清理。
//_totalAccesses 所有的值的访问都会 +1
NSUInteger averageAccesses = (_totalAccesses / count * 0.2) + 1;
//accessCount 每次 obj 取值时会 +1
if (obj->accessCount < averageAccesses && obj->isEvictable)
在清理之前还需要一些准备工作,包括标记 Cached 对象的 isEvictable 防止后面有不安全的线程操作。将满足条件的清理 objects 放到清理数组里,如果空间释放足够就不用再把更多的 objects 加到清理数组里了,最后遍历清理数组进行逐个清理即可。
NSUInteger cost = obj->cost;
obj->cost = 0;
// 不会被再次清除
obj->isEvictable = NO;
// 添加到 remove list 里
if (_evictsObjectsWithDiscardedContent)
{
    [evictedKeys addObject: obj->key];
}
_totalCost -= cost;
// 如果已经释放了足够空间就不用后面操作了
if (cost > spaceNeeded)
{
    break;
}
spaceNeeded -= cost;
在清理时会执行回调内容,这样如果有些缓存数据需要持续化存储可以在回调里进行处理。
- (void) removeObjectForKey: (id)key
{
    _GSCachedObject *obj = [_objects objectForKey: key];

    if (nil != obj)
    {
        [_delegate cache: self willEvictObject: obj->object];
        _totalAccesses -= obj->accessCount;
        [_objects removeObjectForKey: key];
        [_accesses removeObjectIdenticalTo: obj];
    }
}
完整的实现可以查看 GNUstep Base 的 NSCache.m 文件。
下面可以看看 NSCache 在 SDWebImage 的运用是怎么样的:
- (UIImage *)imageFromMemoryCacheForKey:(NSString *)key {
    return [self.memCache objectForKey:key];
}
- (UIImage *)imageFromDiskCacheForKey:(NSString *)key {
    // 检查 NSCache 里是否有
    UIImage *image = [self imageFromMemoryCacheForKey:key];
    if (image) {
        return image;
    }
    // 从磁盘里读
    UIImage *diskImage = [self diskImageForKey:key];
    if (diskImage && self.shouldCacheImagesInMemory) {
        NSUInteger cost = SDCacheCostForImage(diskImage);
        [self.memCache setObject:diskImage forKey:key cost:cost];
    }
    return diskImage;
}
可以看出利用 NSCache 自动释放内存的特点将图片都放到 NSCache 里这样在内存不够用时可以自动清理掉不常用的那些图片,在读取 Cache 里内容时如果没有被清理会直接返回图片数据,清理了的话才会执行 I/O 从磁盘读取图片,通过这种方式能够利用空间减少磁盘操作,空间也能够更加有效的控制释放。
控制 App 的 Wake 次数
通知,VoIP,定位,蓝牙等都会使设备从 Standby 状态唤起。唤起这个过程会有比较大的消耗,应该避免频繁发生。通知方面主要要在产品层面多做考虑。定位方面,下面可以看看定位的一些 API 看看它们对性能的不同影响,便于考虑采用合适的接口。
连续的位置更新
[locationManager startUpdatingLocation]这个方法会时设备一直处于活跃状态。
延时有效定位
[locationManager allowDeferredLocationUpdatesUntilTraveled: timeout:]高效节能的定位方式,数据会缓存在位置硬件上。适合于跑步应用应该都采用这种方式。
重大位置变化
[locationManager startMonitoringSignificantLocationChanges]会更节能,对于那些只有在位置有很大变化的才需要回调的应用可以采用这种,比如天气应用。
区域监测
[locationManager startMonitoringForRegion:(CLRegion *)]也是一种节能的定位方式,比如在博物馆里按照不同区域监测展示不同信息之类的应用比较适合这种定位。
经常访问的地方
// Start monitoring
locationManager.startMonitoringVisits()
// Stop monitoring when no longer needed
locationManager.stopMonitoringVisits()
总的来说,不要轻易使用 startUpdatingLocation() 除非万不得已,尽快的使用 stopUpdatingLocation() 来结束定位还用户一个节能设备。
内存对于性能的影响
首先 Reclaiming 内存是需要时间的,突然的大量内存需求是会影响响应的。
如何预防这些性能问题,需要刻意预防么
坚持下面几个原则争取在编码阶段避免一些性能问题。
- 优化计算的复杂度从而减少 CPU 的使用
- 在应用响应交互的时候停止没必要的任务处理
- 设置合适的 QoS
- 将定时器任务合并,让 CPU 更多时候处于 idle 状态
那么如果写需求时来不及注意这些问题做不到预防的话,可以通过自动化代码检查的方式来避免这些问题吗?
如何检查
根据这些问题在代码里查,写工具或用工具自动化查?虽然可以,但是需要考虑的情况太多,现有工具支持不好,自己写需要考虑的点太多需要花费太长的时间,那么什么方式会比较好呢?
通过监听主线程方式来监察
首先用 CFRunLoopObserverCreate 创建一个观察者里面接受 CFRunLoopActivity 的回调,然后用 CFRunLoopAddObserver 将观察者添加到 CFRunLoopGetMain() 主线程 Runloop 的 kCFRunLoopCommonModes 模式下进行观察。
接下来创建一个子线程来进行监控,使用 dispatch_semaphore_wait 定义区间时间,标准是 16 或 20 微秒一次监控的话基本可以把影响响应的都找出来。监控结果的标准是根据两个 Runloop 的状态 BeforeSources 和 AfterWaiting 在区间时间是否能检测到来判断是否卡顿。
如何打印堆栈信息,保存现场
打印堆栈整体思路是获取线程的信息得到线程的 state 从而得到线程里所有栈的指针,根据这些指针在 符号表里找到对应的描述即符号化解析,这样就能够展示出可读的堆栈信息。具体实现是怎样的呢?下面详细说说:
获取线程的信息
这里首先是要通过 task_threads 取到所有的线程,
thread_act_array_t threads; //int 组成的数组比如 thread[1] = 5635
mach_msg_type_number_t thread_count = 0; //mach_msg_type_number_t 是 int 类型
const task_t this_task = mach_task_self(); //int
//根据当前 task 获取所有线程
kern_return_t kr = task_threads(this_task, &threads, &thread_count);
遍历时通过 thread_info 获取各个线程的详细信息
SMThreadInfoStruct threadInfoSt = {0};
thread_info_data_t threadInfo;
thread_basic_info_t threadBasicInfo;
mach_msg_type_number_t threadInfoCount = THREAD_INFO_MAX;

if (thread_info((thread_act_t)thread, THREAD_BASIC_INFO, (thread_info_t)threadInfo, &threadInfoCount) == KERN_SUCCESS) {
    threadBasicInfo = (thread_basic_info_t)threadInfo;
    if (!(threadBasicInfo->flags & TH_FLAGS_IDLE)) {
        threadInfoSt.cpuUsage = threadBasicInfo->cpu_usage / 10;
        threadInfoSt.userTime = threadBasicInfo->system_time.microseconds;
    }
}

uintptr_t buffer[100];
int i = 0;
NSMutableString *reStr = [NSMutableString stringWithFormat:@"Stack of thread: %u:\n CPU used: %.1f percent\n user time: %d second\n", thread, threadInfoSt.cpuUsage, threadInfoSt.userTime];
获取线程里所有栈的信息
可以通过 thread_get_state 得到 machine context 里面包含了线程栈里所有的栈指针。
_STRUCT_MCONTEXT machineContext; //线程栈里所有的栈指针
//通过 thread_get_state 获取完整的 machineContext 信息,包含 thread 状态信息
mach_msg_type_number_t state_count = smThreadStateCountByCPU();
kern_return_t kr = thread_get_state(thread, smThreadStateByCPU(), (thread_state_t)&machineContext.__ss, &state_count);
创建一个栈结构体用来保存栈的数据
//为通用回溯设计结构支持栈地址由小到大,地址里存储上个栈指针的地址
typedef struct SMStackFrame {
    const struct SMStackFrame *const previous;
    const uintptr_t return_address;
} SMStackFrame;

SMStackFrame stackFrame = {0};
//通过栈基址指针获取当前栈帧地址
const uintptr_t framePointer = smMachStackBasePointerByCPU(&machineContext);
if (framePointer == 0 || smMemCopySafely((void *)framePointer, &stackFrame, sizeof(stackFrame)) != KERN_SUCCESS) {
    return @"Fail frame pointer";
}
for (; i < 32; i++) {
    buffer[i] = stackFrame.return_address;
    if (buffer[i] == 0 || stackFrame.previous == 0 || smMemCopySafely(stackFrame.previous, &stackFrame, sizeof(stackFrame)) != KERN_SUCCESS) {
        break;
    }
}
符号化
符号化主要思想就是通过栈指针地址减去 Slide 地址得到 ASLR 偏移量,通过这个偏移量可以在 __LINKEDIT segment 查找到字符串和符号表的位置。具体代码实现如下:
info->dli_fname = NULL;
info->dli_fbase = NULL;
info->dli_sname = NULL;
info->dli_saddr = NULL;
//根据地址获取是哪个 image
const uint32_t idx = smDyldImageIndexFromAddress(address);
if (idx == UINT_MAX) {
    return false;
}
/*
 Header
 ------------------
 Load commands
 Segment command 1 -------------|
 Segment command 2              |
 ------------------             |
 Data                           |
 Section 1 data |segment 1 <----|
 Section 2 data |          <----|
 Section 3 data |          <----|
 Section 4 data |segment 2
 Section 5 data |
 ...            |
 Section n data |
 */
/*----------Mach Header---------*/
//根据 image 的序号获取 mach_header
const struct mach_header* machHeader = _dyld_get_image_header(idx);
//返回 image_index 索引的 image 的虚拟内存地址 slide 的数量,如果 image_index 超出范围返回0
//动态链接器加载 image 时,image 必须映射到未占用地址的进程的虚拟地址空间。动态链接器通过添加一个值到 image 的基地址来实现,这个值是虚拟内存 slide 数量
const uintptr_t imageVMAddressSlide = (uintptr_t)_dyld_get_image_vmaddr_slide(idx);
/*-----------ASLR 的偏移量---------*/
//https://en.wikipedia.org/wiki/Address_space_layout_randomization
const uintptr_t addressWithSlide = address - imageVMAddressSlide;
//根据 Image 的 Index 来获取 segment 的基地址
//段定义Mach-O文件中的字节范围以及动态链接器加载应用程序时这些字节映射到虚拟内存中的地址和内存保护属性。 因此,段总是虚拟内存页对齐。 片段包含零个或多个节。
const uintptr_t segmentBase = smSegmentBaseOfImageIndex(idx) + imageVMAddressSlide;
if (segmentBase == 0) {
    return false;
}
//
info->dli_fname = _dyld_get_image_name(idx);
info->dli_fbase = (void*)machHeader;

/*--------------Mach Segment-------------*/
//地址最匹配的symbol
const nlistByCPU* bestMatch = NULL;
uintptr_t bestDistance = ULONG_MAX;
uintptr_t cmdPointer = smCmdFirstPointerFromMachHeader(machHeader);
if (cmdPointer == 0) {
    return false;
}
//遍历每个 segment 判断目标地址是否落在该 segment 包含的范围里
for (uint32_t iCmd = 0; iCmd < machHeader->ncmds; iCmd++) {
    const struct load_command* loadCmd = (struct load_command*)cmdPointer;
    /*----------目标 Image 的符号表----------*/
    //Segment 除了 __TEXT 和 __DATA 外还有 __LINKEDIT segment,它里面包含动态链接器的使用的原始数据,比如符号,字符串和重定位表项。
    //LC_SYMTAB 描述了 __LINKEDIT segment 内查找字符串和符号表的位置
    if (loadCmd->cmd == LC_SYMTAB) {
        //获取字符串和符号表的虚拟内存偏移量。
        const struct symtab_command* symtabCmd = (struct symtab_command*)cmdPointer;
        const nlistByCPU* symbolTable = (nlistByCPU*)(segmentBase + symtabCmd->symoff);
        const uintptr_t stringTable = segmentBase + symtabCmd->stroff;

        for (uint32_t iSym = 0; iSym < symtabCmd->nsyms; iSym++) {
            //如果 n_value 是0,symbol 指向外部对象
            if (symbolTable[iSym].n_value != 0) {
                //给定的偏移量是文件偏移量,减去 __LINKEDIT segment 的文件偏移量获得字符串和符号表的虚拟内存偏移量
                uintptr_t symbolBase = symbolTable[iSym].n_value;
                uintptr_t currentDistance = addressWithSlide - symbolBase;
                //寻找最小的距离 bestDistance,因为 addressWithSlide 是某个方法的指令地址,要大于这个方法的入口。
                //离 addressWithSlide 越近的函数入口越匹配
                if ((addressWithSlide >= symbolBase) && (currentDistance <= bestDistance)) {
                    bestMatch = symbolTable + iSym;
                    bestDistance = currentDistance;
                }
            }
        }
        if (bestMatch != NULL) {
            //将虚拟内存偏移量添加到 __LINKEDIT segment 的虚拟内存地址可以提供字符串和符号表的内存 address。
            info->dli_saddr = (void*)(bestMatch->n_value + imageVMAddressSlide);
            info->dli_sname = (char*)((intptr_t)stringTable + (intptr_t)bestMatch->n_un.n_strx);
            if (*info->dli_sname == '_') {
                info->dli_sname++;
            }
            //所有的 symbols 的已经被处理好了
            if (info->dli_saddr == info->dli_fbase && bestMatch->n_type == 3) {
                info->dli_sname = NULL;
            }
            break;
        }
    }
    cmdPointer += loadCmd->cmdsize;
}
需要注意的地方
需要注意的是这个程序有消耗性能的地方 thread get state。这个也会被监控检查出,所以可以过滤掉这样的堆栈信息。
能够获取更多信息的方法
获取更多信息比如全层级方法调用和每个方法消耗的时间,那么这样做的好处在哪呢?
可以更细化的测量时间消耗,找到耗时方法,更快的交互操作能使用户体验更好,下面是一些可以去衡量的场景:
- 响应能力
- 按钮点击
- 手势操作
- Tab 切换
- vc 的切换和转场
可以给优化定个目标,比如滚动和动画达到 60fps,响应用户操作在 100ms 内完成。然后逐个检测出来 fix 掉。
如何获取到更多信息呢?
通过 hook objc_msgSend 方法能够获取所有被调用的方法,记录深度就能够得到方法调用的树状结构,通过执行前后时间的记录能够得到每个方法的耗时,这样就能获取一份完整的性能消耗信息了。
hook c 函数可以使用 facebook 的 fishhook, 获取方法调用树状结构可以使用 InspectiveC,下面对于他们的实现详细介绍一下:
获取方法调用树结构
首先设计两个结构体,CallRecord 记录调用方法详细信息,包括 obj 和 SEL 等,ThreadCallStack 里面需要用 index 记录当前调用方法树的深度。有了 SEL 再通过 NSStringFromSelector 就能够取得方法名,有了 obj 通过 object_getClass 能够得到 Class 再用 NSStringFromClass 就能够获得类名。
// Shared structures.
typedef struct CallRecord_ {
  id obj;   //通过 object_getClass 能够得到 Class 再通过 NSStringFromClass 能够得到类名
  SEL _cmd; //通过 NSStringFromSelector 方法能够得到方法名
  uintptr_t lr;
  int prevHitIndex;
  char isWatchHit;
} CallRecord;

typedef struct ThreadCallStack_ {
  FILE *file;
  char *spacesStr;
  CallRecord *stack;
  int allocatedLength;
  int index; //index 记录当前调用方法树的深度
  int numWatchHits;
  int lastPrintedIndex;
  int lastHitIndex;
  char isLoggingEnabled;
  char isCompleteLoggingEnabled;
} ThreadCallStack;
存储读取 ThreadCallStack
pthread_setspecific() 可以将私有数据设置在指定线程上,pthread_getspecific() 用来读取这个私有数据,利用这个特性可以就可以将 ThreadCallStack 的数据和该线程绑定在一起,随时进行数据的存取。代码如下:
static inline ThreadCallStack * getThreadCallStack() {
  ThreadCallStack *cs = (ThreadCallStack *)pthread_getspecific(threadKey); //读取
  if (cs == NULL) {
    cs = (ThreadCallStack *)malloc(sizeof(ThreadCallStack));
#ifdef MAIN_THREAD_ONLY
    cs->file = (pthread_main_np()) ? newFileForThread() : NULL;
#else
    cs->file = newFileForThread();
#endif
    cs->isLoggingEnabled = (cs->file != NULL);
    cs->isCompleteLoggingEnabled = 0;
    cs->spacesStr = (char *)malloc(DEFAULT_CALLSTACK_DEPTH + 1);
    memset(cs->spacesStr, ' ', DEFAULT_CALLSTACK_DEPTH);
    cs->spacesStr[DEFAULT_CALLSTACK_DEPTH] = '\0';
    cs->stack = (CallRecord *)calloc(DEFAULT_CALLSTACK_DEPTH, sizeof(CallRecord)); //分配 CallRecord 默认空间
    cs->allocatedLength = DEFAULT_CALLSTACK_DEPTH;
    cs->index = cs->lastPrintedIndex = cs->lastHitIndex = -1;
    cs->numWatchHits = 0;
    pthread_setspecific(threadKey, cs); //保存数据
  }
  return cs;
}
记录方法调用深度
因为要记录深度,而一个方法的调用里会有更多的方法调用,所以方法的调用写两个方法分别记录开始 pushCallRecord 和记录结束的时刻 popCallRecord,这样才能够通过在开始时对深度加一在结束时减一。
//开始时
static inline void pushCallRecord(id obj, uintptr_t lr, SEL _cmd, ThreadCallStack *cs) {
  int nextIndex = (++cs->index); //增加深度
  if (nextIndex >= cs->allocatedLength) {
    cs->allocatedLength += CALLSTACK_DEPTH_INCREMENT;
    cs->stack = (CallRecord *)realloc(cs->stack, cs->allocatedLength * sizeof(CallRecord));
    cs->spacesStr = (char *)realloc(cs->spacesStr, cs->allocatedLength + 1);
    memset(cs->spacesStr, ' ', cs->allocatedLength);
    cs->spacesStr[cs->allocatedLength] = '\0';
  }
  CallRecord *newRecord = &cs->stack[nextIndex];
  newRecord->obj = obj;
  newRecord->_cmd = _cmd;
  newRecord->lr = lr;
  newRecord->isWatchHit = 0;
}
//结束时
static inline CallRecord * popCallRecord(ThreadCallStack *cs) {
  return &cs->stack[cs->index--]; //减少深度
}
在 objc_msgSend 前后插入执行方法
最后是 hook objc_msgSend 需要在调用前和调用后分别加入 pushCallRecord 和 popCallRecord。因为需要在调用后这个时机插入一个方法,而且不可能编写一个保留未知参数并跳转到 c 中任意函数指针的函数,那么这就需要用到汇编来做到。
下面针对 arm64 进行分析,arm64 有31个64 bit 的整数型寄存器,用 x0 到 x30 表示,主要思路就是先入栈参数,参数寄存器是 x0 - x7,对于objc_msgSend方法来说 x0 第一个参数是传入对象,x1 第二个参数是选择器 _cmd。 syscall 的 number 会放到 x8 里。然后交换寄存器中,将用于返回的寄存器 lr 移到 x1 里。先让 pushCallRecord 能够执行,再执行原始的 objc_msgSend,保存返回值,最后让 popCallRecord 能执行。具体代码如下:
static void replacementObjc_msgSend() {
  __asm__ volatile (
    // sp 是堆栈寄存器,存放栈的偏移地址,每次都指向栈顶。
    // 保存 {q0-q7} 偏移地址到 sp 寄存器
      "stp q6, q7, [sp, #-32]!\n"
      "stp q4, q5, [sp, #-32]!\n"
      "stp q2, q3, [sp, #-32]!\n"
      "stp q0, q1, [sp, #-32]!\n"
    // 保存 {x0-x8, lr}
      "stp x8, lr, [sp, #-16]!\n"
      "stp x6, x7, [sp, #-16]!\n"
      "stp x4, x5, [sp, #-16]!\n"
      "stp x2, x3, [sp, #-16]!\n"
      "stp x0, x1, [sp, #-16]!\n"
    // 交换参数.
      "mov x2, x1\n"
      "mov x1, lr\n"
      "mov x3, sp\n"
    // 调用 preObjc_msgSend,使用 bl label 语法。bl 执行一个分支链接操作,label 是无条件分支的,是和本指令的地址偏移,范围是 -128MB 到 +128MB
      "bl __Z15preObjc_msgSendP11objc_objectmP13objc_selectorP9RegState_\n"
      "mov x9, x0\n"
      "mov x10, x1\n"
      "tst x10, x10\n"
    // 读取 {x0-x8, lr} 从保存到 sp 栈顶的偏移地址读起
      "ldp x0, x1, [sp], #16\n"
      "ldp x2, x3, [sp], #16\n"
      "ldp x4, x5, [sp], #16\n"
      "ldp x6, x7, [sp], #16\n"
      "ldp x8, lr, [sp], #16\n"
    // 读取 {q0-q7}
      "ldp q0, q1, [sp], #32\n"
      "ldp q2, q3, [sp], #32\n"
      "ldp q4, q5, [sp], #32\n"
      "ldp q6, q7, [sp], #32\n"
      "b.eq Lpassthrough\n"
    // 调用原始 objc_msgSend。使用 blr xn 语法。blr 除了从指定寄存器读取新的 PC 值外效果和 bl 一样。xn 是通用寄存器的64位名称分支地址,范围0到31
      "blr x9\n"
    // 保存 {x0-x9}
      "stp x0, x1, [sp, #-16]!\n"
      "stp x2, x3, [sp, #-16]!\n"
      "stp x4, x5, [sp, #-16]!\n"
      "stp x6, x7, [sp, #-16]!\n"
      "stp x8, x9, [sp, #-16]!\n"
    // 保存 {q0-q7}
      "stp q0, q1, [sp, #-32]!\n"
      "stp q2, q3, [sp, #-32]!\n"
      "stp q4, q5, [sp, #-32]!\n"
      "stp q6, q7, [sp, #-32]!\n"
    // 调用 postObjc_msgSend hook.
      "bl __Z16postObjc_msgSendv\n"
      "mov lr, x0\n"
    // 读取 {q0-q7}
      "ldp q6, q7, [sp], #32\n"
      "ldp q4, q5, [sp], #32\n"
      "ldp q2, q3, [sp], #32\n"
      "ldp q0, q1, [sp], #32\n"
    // 读取 {x0-x9}
      "ldp x8, x9, [sp], #16\n"
      "ldp x6, x7, [sp], #16\n"
      "ldp x4, x5, [sp], #16\n"
      "ldp x2, x3, [sp], #16\n"
      "ldp x0, x1, [sp], #16\n"
      "ret\n"
      "Lpassthrough:\n"
    // br 无条件分支到寄存器中的地址
      "br x9"
    );
}
记录时间的方法
为了记录耗时,这样就需要在 pushCallRecord 和 popCallRecord 里记录下时间。下面列出一些计算一段代码开始到结束的时间的方法
第一种: NSDate 微秒
NSDate* tmpStartData = [NSDate date];
//some code need caculate
double deltaTime = [[NSDate date] timeIntervalSinceDate:tmpStartData];
NSLog(@"cost time: %f s", deltaTime);
第二种:clock_t 微秒clock_t计时所表示的是占用CPU的时钟单元
clock_t start = clock();
//some code need caculate
clock_t end = clock();
NSLog(@"cost time: %f s", (double)(end - start)/CLOCKS_PER_SEC);
第三种:CFAbsoluteTime 微秒
CFAbsoluteTime start = CFAbsoluteTimeGetCurrent();
//some code need caculate
CFAbsoluteTime end = CFAbsoluteTimeGetCurrent();
NSLog(@"cost time = %f s", end - start); //s
第四种:CFTimeInterval 纳秒
CFTimeInterval start = CACurrentMediaTime();
//some code need caculate
CFTimeInterval end = CACurrentMediaTime();
NSLog(@"cost time: %f s", end - start);
第五种:mach_absolute_time 纳秒
uint64_t start = mach_absolute_time ();
//some code need caculate
uint64_t end = mach_absolute_time ();
uint64_t elapsed = 1e-9 *(end - start);
最后两种可用,本质区别
NSDate 或 CFAbsoluteTimeGetCurrent() 返回的时钟时间将会会网络时间同步,从时钟 偏移量的角度。mach_absolute_time() 和 CACurrentMediaTime() 是基于内建时钟的。选择一种,加到 pushCallRecord 和 popCallRecord 里,相减就能够获得耗时。
如何 hook msgsend 方法
那么 objc_msgSend 这个 c 方法是如何 hook 到的呢。首先了解下 dyld 是通过更新 Mach-O 二进制的 __DATA segment 特定的部分中的指针来邦定 lazy 和 non-lazy 符号,通过确认传递给 rebind_symbol 里每个符号名称更新的位置就可以找出对应替换来重新绑定这些符号。下面针对关键代码进行分析:
遍历 dyld
首先是遍历 dyld 里的所有的 image,取出 image header 和 slide。注意第一次调用时主要注册 callback。
if (!_rebindings_head->next) {
    _dyld_register_func_for_add_image(_rebind_symbols_for_image);
} else {
    uint32_t c = _dyld_image_count();
    for (uint32_t i = 0; i < c; i++) {
        _rebind_symbols_for_image(_dyld_get_image_header(i), _dyld_get_image_vmaddr_slide(i));
    }
}
找出符号表相关 Command
接下来需要找到符号表相关的 command,包括 linkedit segment command,symtab command 和 dysymtab command。方法如下:
segment_command_t *cur_seg_cmd;
segment_command_t *linkedit_segment = NULL;
struct symtab_command* symtab_cmd = NULL;
struct dysymtab_command* dysymtab_cmd = NULL;

uintptr_t cur = (uintptr_t)header + sizeof(mach_header_t);
for (uint i = 0; i < header->ncmds; i++, cur += cur_seg_cmd->cmdsize) {
    cur_seg_cmd = (segment_command_t *)cur;
    if (cur_seg_cmd->cmd == LC_SEGMENT_ARCH_DEPENDENT) {
        if (strcmp(cur_seg_cmd->segname, SEG_LINKEDIT) == 0) {
            linkedit_segment = cur_seg_cmd;
        }
    } else if (cur_seg_cmd->cmd == LC_SYMTAB) {
        symtab_cmd = (struct symtab_command*)cur_seg_cmd;
    } else if (cur_seg_cmd->cmd == LC_DYSYMTAB) {
        dysymtab_cmd = (struct dysymtab_command*)cur_seg_cmd;
    }
}
获得 base 和 indirect 符号表
// Find base symbol/string table addresses
uintptr_t linkedit_base = (uintptr_t)slide + linkedit_segment->vmaddr - linkedit_segment->fileoff;
nlist_t *symtab = (nlist_t *)(linkedit_base + symtab_cmd->symoff);
char *strtab = (char *)(linkedit_base + symtab_cmd->stroff);

// Get indirect symbol table (array of uint32_t indices into symbol table)
uint32_t *indirect_symtab = (uint32_t *)(linkedit_base + dysymtab_cmd->indirectsymoff);
进行方法替换
有了符号表和传入的方法替换数组就可以进行符号表访问指针地址的替换,具体实现如下:
uint32_t *indirect_symbol_indices = indirect_symtab + section->reserved1;
void **indirect_symbol_bindings = (void **)((uintptr_t)slide + section->addr);
for (uint i = 0; i < section->size / sizeof(void *); i++) {
    uint32_t symtab_index = indirect_symbol_indices[i];
    if (symtab_index == INDIRECT_SYMBOL_ABS || symtab_index == INDIRECT_SYMBOL_LOCAL ||
        symtab_index == (INDIRECT_SYMBOL_LOCAL   | INDIRECT_SYMBOL_ABS)) {
        continue;
    }
    uint32_t strtab_offset = symtab[symtab_index].n_un.n_strx;
    char *symbol_name = strtab + strtab_offset;
    if (strnlen(symbol_name, 2) < 2) {
        continue;
    }
    struct rebindings_entry *cur = rebindings;
    while (cur) {
        for (uint j = 0; j < cur->rebindings_nel; j++) {
            if (strcmp(&symbol_name[1], cur->rebindings[j].name) == 0) {
                if (cur->rebindings[j].replaced != NULL &&
                    indirect_symbol_bindings[i] != cur->rebindings[j].replacement) {
                    *(cur->rebindings[j].replaced) = indirect_symbol_bindings[i];
                }
                indirect_symbol_bindings[i] = cur->rebindings[j].replacement;
                goto symbol_loop;
            }
        }
        cur = cur->next;
    }
symbol_loop:;
统计方法调用频次
在一些应用场景会有一些频繁的方法调用,有些方法的调用实际上是没有必要的,但是首先是需要将那些频繁调用的方法找出来这样才能够更好的定位到潜在的会造成性能浪费的方法使用。这些频繁调用的方法要怎么找呢?
大致的思路是这样,基于上面章节提到的记录方法调用深度的方案,将每个调用方法的路径保存住,调用相同路径的相同方法调用一次加一记录在数据库中,最后做一个视图按照调用次数的排序即可找到调用频繁的那些方法。下图是完成后展示的效果:
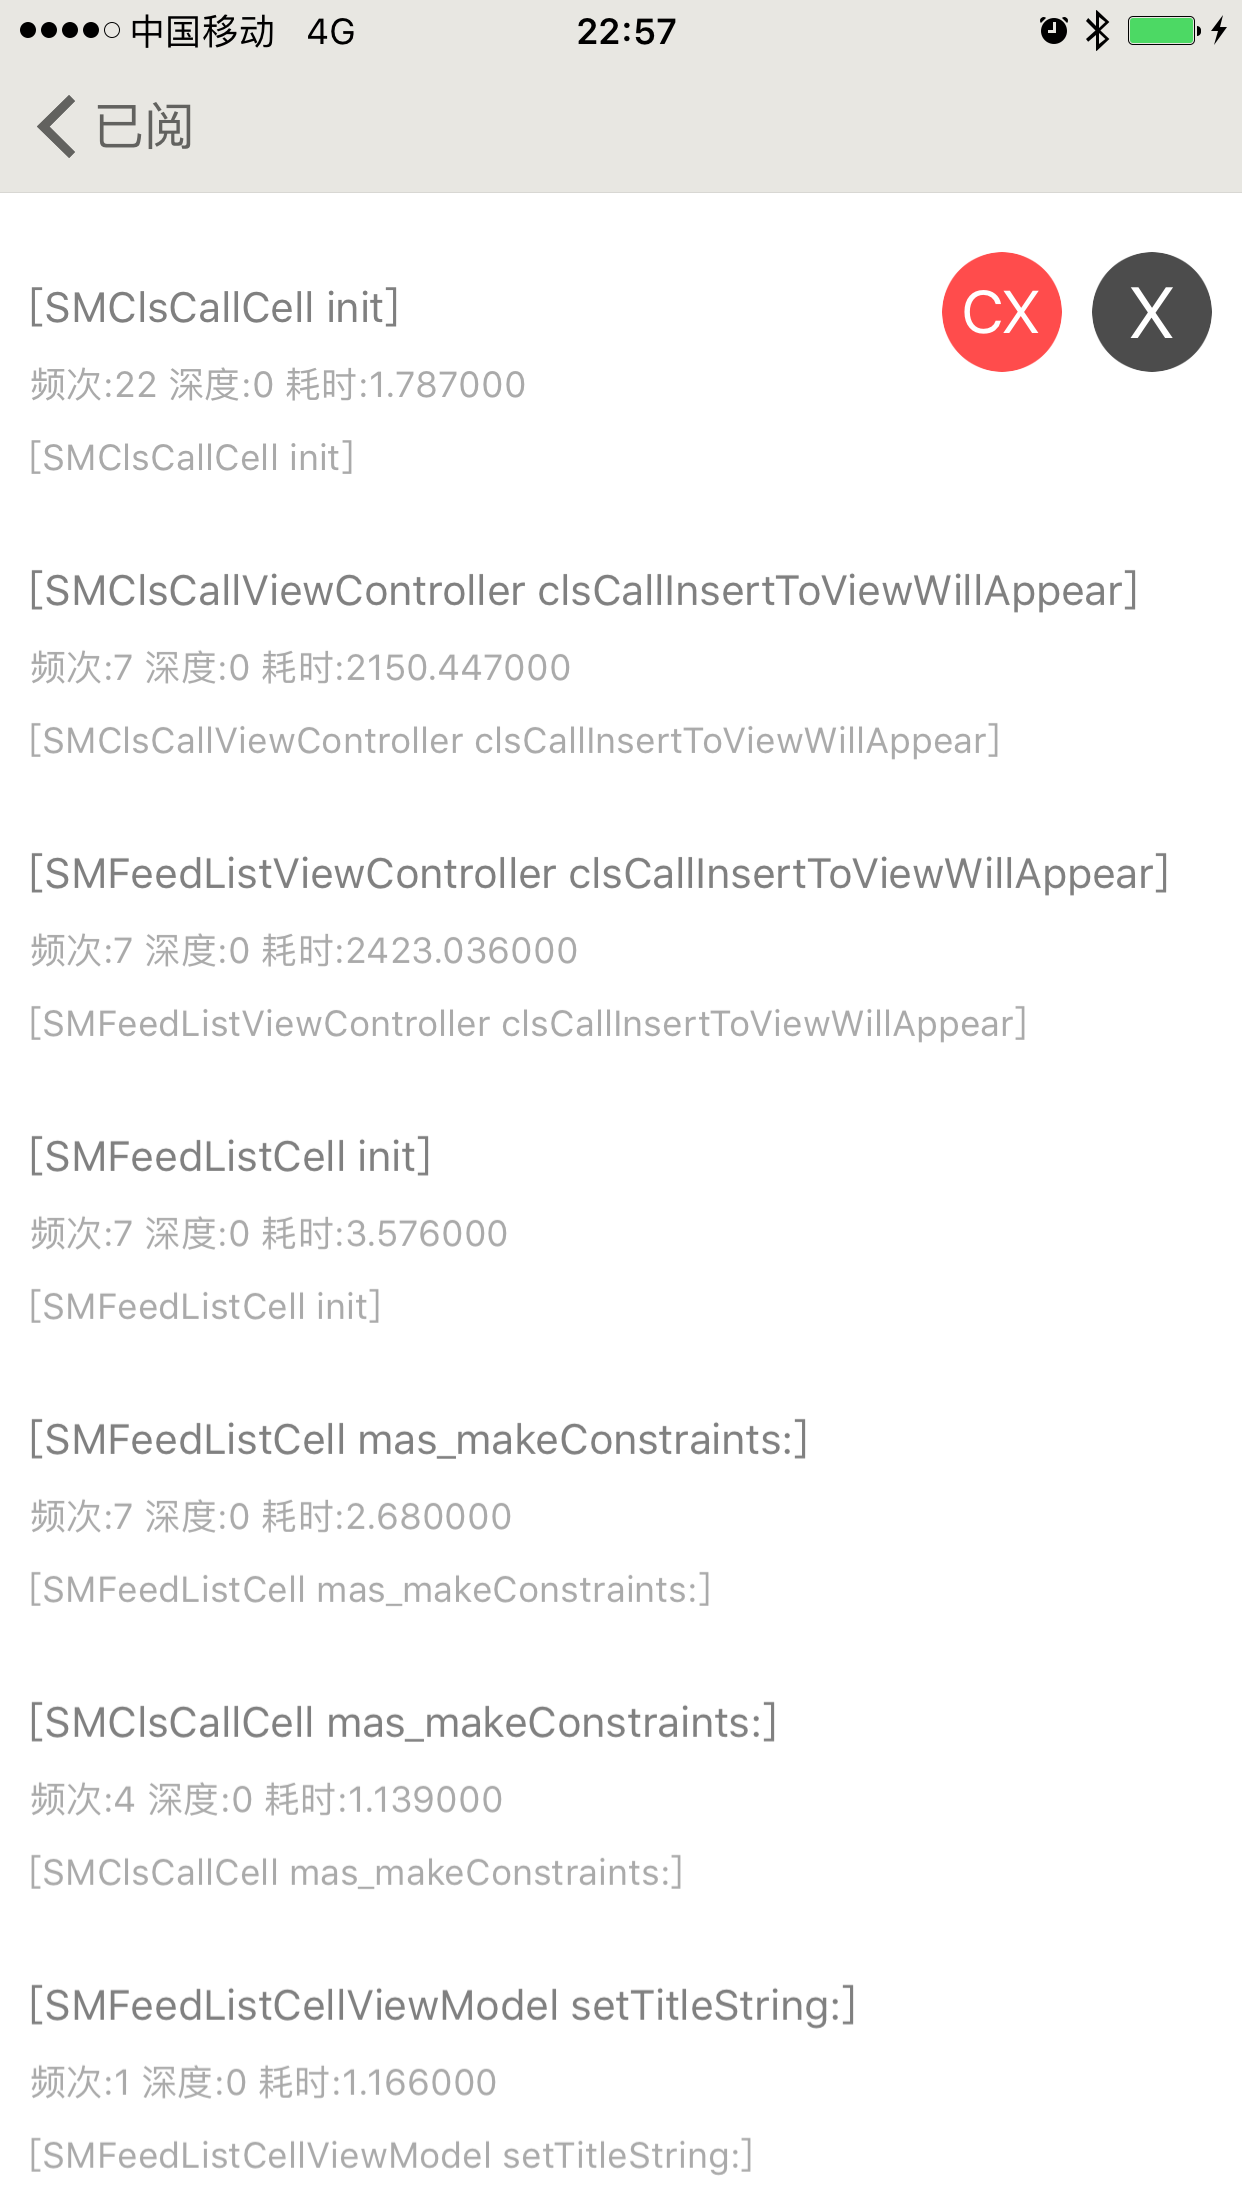
接下来看看具体实现方式
设计方法调用频次记录的结构
在先前时间消耗的 model 基础上增加路径,频次等信息
@property (nonatomic, strong) NSString *className;       //类名
@property (nonatomic, strong) NSString *methodName;      //方法名
@property (nonatomic, assign) BOOL isClassMethod;        //是否是类方法
@property (nonatomic, assign) NSTimeInterval timeCost;   //时间消耗
@property (nonatomic, assign) NSUInteger callDepth;      //Call 层级
@property (nonatomic, copy) NSString *path;              //路径
@property (nonatomic, assign) BOOL lastCall;             //是否是最后一个 Call
@property (nonatomic, assign) NSUInteger frequency;      //访问频次
@property (nonatomic, strong) NSArray <SMCallTraceTimeCostModel *> *subCosts;
拼装方法路径
在遍历 SMCallTrace 记录的方法 model 和 遍历方法子方法时将路径拼装好,记录到数据库中
for (SMCallTraceTimeCostModel *model in arr) {
    //记录方法路径
    model.path = [NSString stringWithFormat:@"[%@ %@]",model.className,model.methodName];
    [self appendRecord:model to:mStr];
}

+ (void)appendRecord:(SMCallTraceTimeCostModel *)cost to:(NSMutableString *)mStr {
    [mStr appendFormat:@"%@\n path%@\n",[cost des],cost.path];
    if (cost.subCosts.count < 1) {
        cost.lastCall = YES;
    }
    //记录到数据库中
    [[[SMLagDB shareInstance] increaseWithClsCallModel:cost] subscribeNext:^(id x) {}];
    for (SMCallTraceTimeCostModel *model in cost.subCosts) {
        //记录方法的子方法的路径
        model.path = [NSString stringWithFormat:@"%@ - [%@ %@]",cost.path,model.className,model.methodName];
        [self appendRecord:model to:mStr];
    }
}
记录方法调用频次数据库
创建数据库
这里的 lastcall 是记录是否是最后一个方法的调用,展示时只取最后一个方法即可,因为也会有完整路径可以知道父方法和来源方法。
_clsCallDBPath = [PATH_OF_DOCUMENT stringByAppendingPathComponent:@"clsCall.sqlite"];
if ([[NSFileManager defaultManager] fileExistsAtPath:_clsCallDBPath] == NO) {
    FMDatabase *db = [FMDatabase databaseWithPath:_clsCallDBPath];
    if ([db open]) {
        /*
         cid: 主id
         fid: 父id 暂时不用
         cls: 类名
         mtd: 方法名
         path: 完整路径标识
         timecost: 方法消耗时长
         calldepth: 层级
         frequency: 调用次数
         lastcall: 是否是最后一个 call
         */
        NSString *createSql = @"create table clscall (cid INTEGER PRIMARY KEY AUTOINCREMENT  NOT NULL, fid integer, cls text, mtd text, path text, timecost integer, calldepth integer, frequency integer, lastcall integer)";
        [db executeUpdate:createSql];
    }
}
添加记录
添加记录时需要先检查数据库里是否有相同路径的同一个方法调用,这样可以给 frequency 字段加一已达到记录频次的目的。
FMResultSet *rsl = [db executeQuery:@"select cid,frequency from clscall where path = ?", model.path];
if ([rsl next]) {
    //有相同路径就更新路径访问频率
    int fq = [rsl intForColumn:@"frequency"] + 1;
    int cid = [rsl intForColumn:@"cid"];
    [db executeUpdate:@"update clscall set frequency = ? where cid = ?", @(fq), @(cid)];
} else {
    //没有就添加一条记录
    NSNumber *lastCall = @0;
    if (model.lastCall) {
        lastCall = @1;
    }
    [db executeUpdate:@"insert into clscall (cls, mtd, path, timecost, calldepth, frequency, lastcall) values (?, ?, ?, ?, ?, ?, ?)", model.className, model.methodName, model.path, @(model.timeCost), @(model.callDepth), @1, lastCall];
}
[db close];
[subscriber sendCompleted];
检索记录
检索时注意按照调用频次字段进行排序即可。
FMResultSet *rs = [db executeQuery:@"select * from clscall where lastcall=? order by frequency desc limit ?, 50",@1, @(page * 50)];
NSUInteger count = 0;
NSMutableArray *arr = [NSMutableArray array];
while ([rs next]) {
    SMCallTraceTimeCostModel *model = [self clsCallModelFromResultSet:rs];
    [arr addObject:model];
    count ++;
}
if (count > 0) {
    [subscriber sendNext:arr];
} else {
    [subscriber sendError:nil];
}
[subscriber sendCompleted];
[db close];
找出 CPU 使用大的线程堆栈
在前面检测卡顿打印的堆栈里提到使用 thread_info 能够获取到各个线程的 cpu 消耗,但是 cpu 不在主线程即使消耗很大也不一定会造成卡顿导致卡顿检测无法检测出更多 cpu 消耗的情况,所以只能通过轮询监控各线程里的 cpu 使用情况,对于超过标准值比如70%的进行记录来跟踪定位出耗电的那些方法。下图是列出 cpu 过载时的堆栈记录的展示效果:
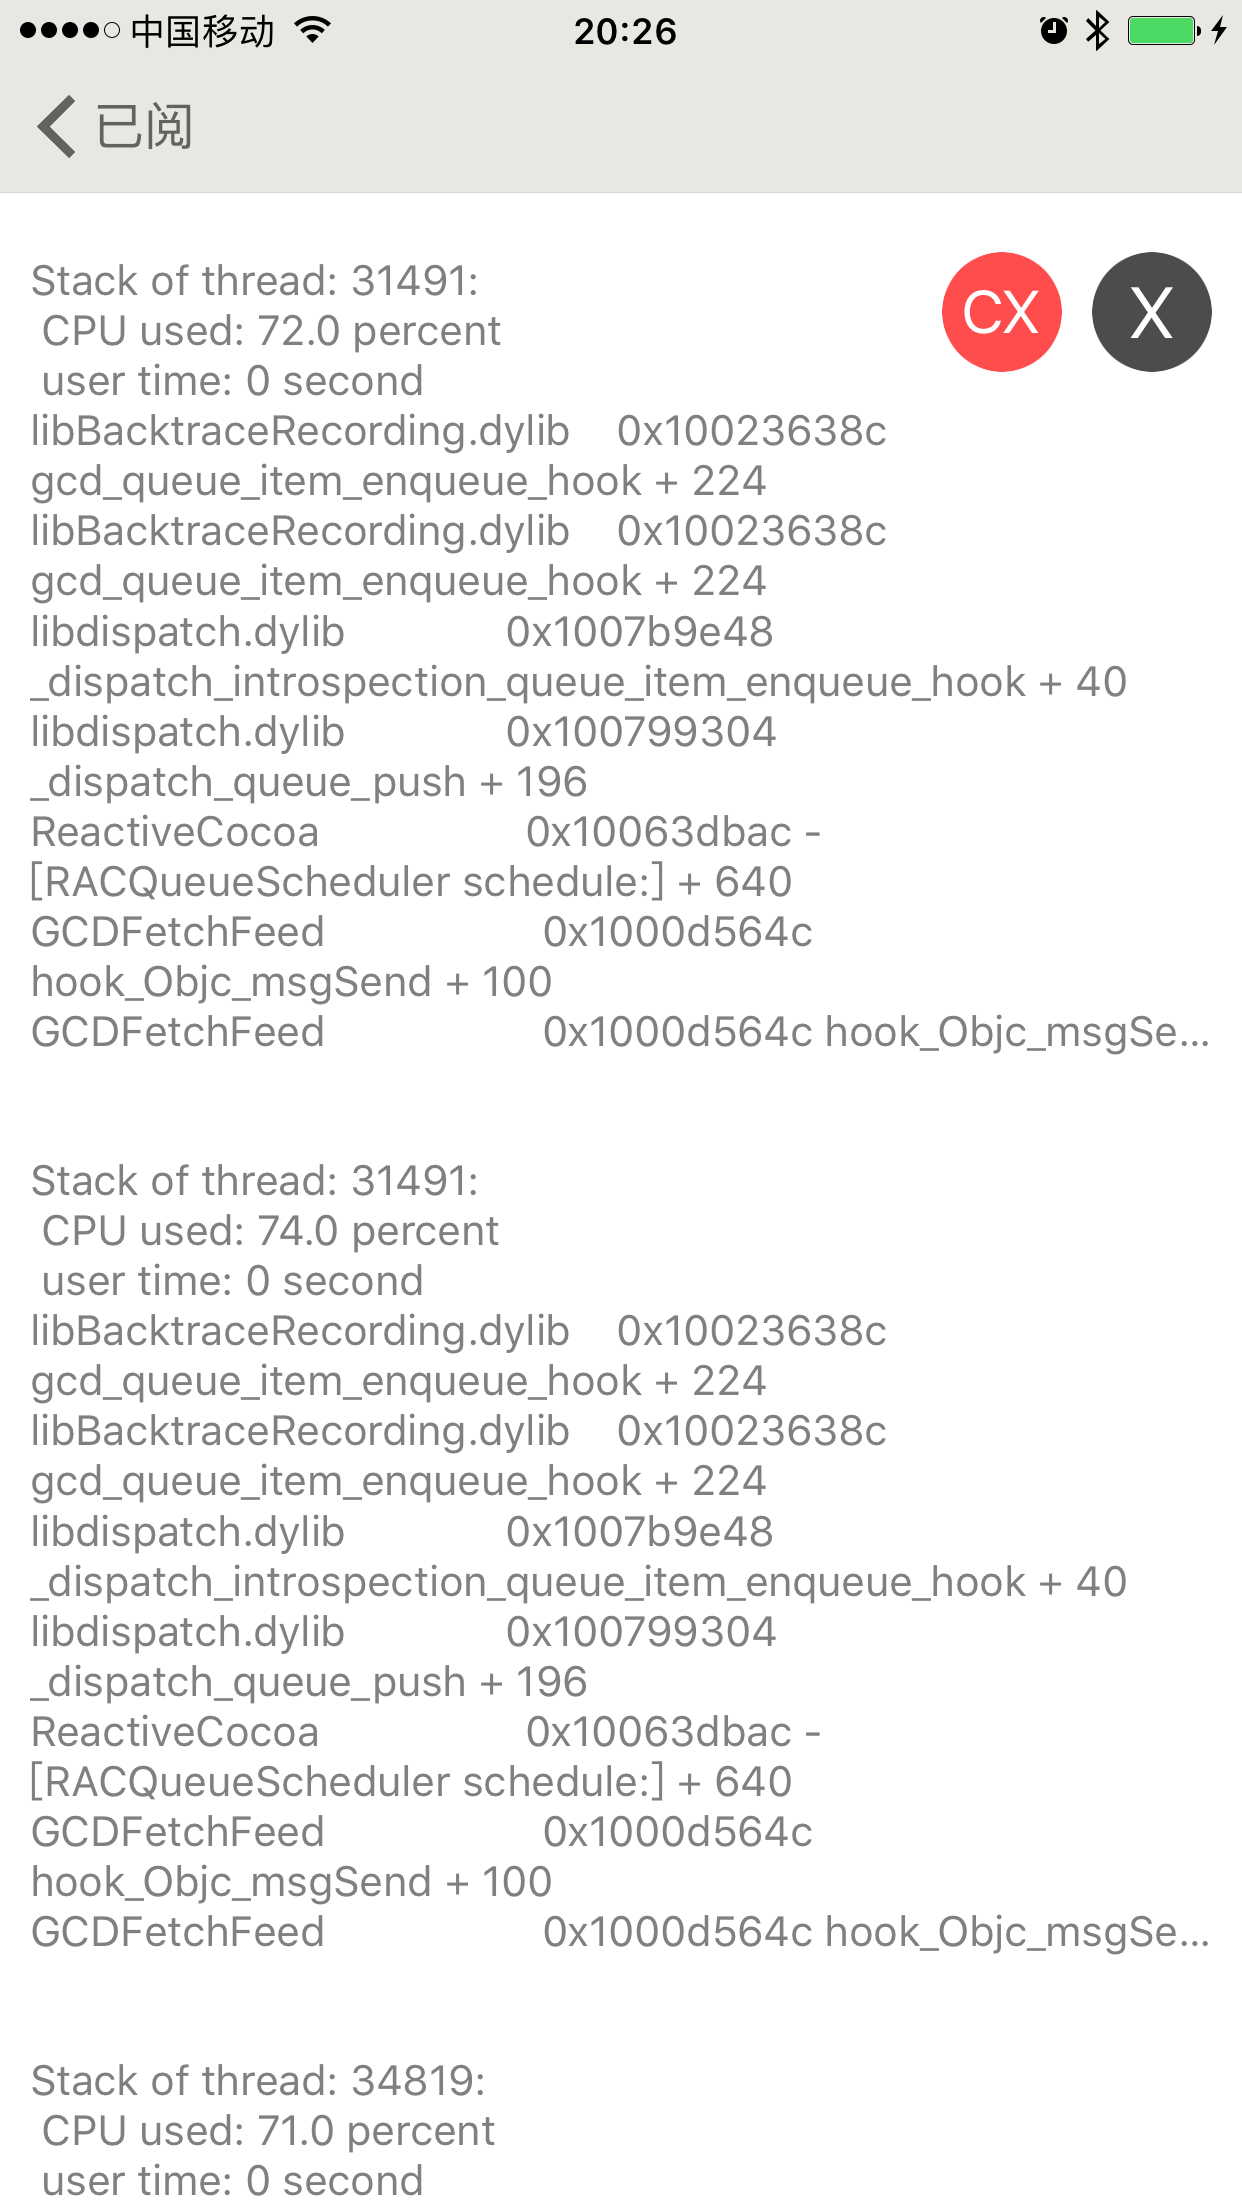
有了前面的基础,实现起来轻松多了
//轮询检查多个线程 cpu 情况
+ (void)updateCPU {
    thread_act_array_t threads;
    mach_msg_type_number_t threadCount = 0;
    const task_t thisTask = mach_task_self();
    kern_return_t kr = task_threads(thisTask, &threads, &threadCount);
    if (kr != KERN_SUCCESS) {
        return;
    }
    for (int i = 0; i < threadCount; i++) {
        thread_info_data_t threadInfo;
        thread_basic_info_t threadBaseInfo;
        mach_msg_type_number_t threadInfoCount = THREAD_INFO_MAX;
        if (thread_info((thread_act_t)threads[i], THREAD_BASIC_INFO, (thread_info_t)threadInfo, &threadInfoCount) == KERN_SUCCESS) {
            threadBaseInfo = (thread_basic_info_t)threadInfo;
            if (!(threadBaseInfo->flags & TH_FLAGS_IDLE)) {
                integer_t cpuUsage = threadBaseInfo->cpu_usage / 10;
                if (cpuUsage > 70) {
                    //cup 消耗大于 70 时打印和记录堆栈
                    NSString *reStr = smStackOfThread(threads[i]);
                    //记录数据库中
                    [[[SMLagDB shareInstance] increaseWithStackString:reStr] subscribeNext:^(id x) {}];
                    NSLog(@"CPU useage overload thread stack:\n%@",reStr);
                }
            }
        }
    }
}
Demo
工具已整合到先前做的 GCDFetchFeed 里。
- 子线程检测主线程卡顿使用的话在需要开始检测的地方添加 [[SMLagMonitor shareInstance] beginMonitor]; 即可。
- 需要检测所有方法调用的用法就是在需要检测的地方调用 [SMCallTrace start]; 就可以了,不检测打印出结果的话调用 stop 和 save 就好了。这里还可以设置最大深度和最小耗时检测来过滤不需要看到的信息。
- 方法调用频次使用可以在需要开始统计的地方加上 [SMCallTrace startWithMaxDepth:3]; 记录时使用 [SMCallTrace stopSaveAndClean]; 记录到到数据库中同时清理内存的占用。可以 hook VC 的 viewWillAppear 和 viewWillDisappear,在 appear 时开始记录,在 disappear 时记录到数据库同时清理一次。结果展示的 view controller 是 SMClsCallViewController,push 出来就能够看到列表结果。
资料
WWDC
- WWDC 2013 224 Designing Code for Performance
- WWDC 2013 408 Optimizing Your Code Using LLVM
- WWDC 2013 712 Energy Best Practices
- WWDC 2014 710 writing energy efficient code part 1
- WWDC 2014 710 writing energy efficient code part 2
- WWDC 2015 230 performance on ios and watchos
- WWDC 2015 707 achieving allday battery life
- WWDC 2015 708 debugging energy issues
- WWDC 2015 718 building responsive and efficient apps with gcd
- WWDC 2016 406 optimizing app startup time
- WWDC 2016 719 optimizing io for performance and battery life
- WWDC 2017 238 writing energy efficient apps
- WWDC 2017 706 modernizing grand central dispatch usage
PS:
最近我这需要招一名实习生来滴滴和我一起攻克一个工程开发效率的项目,绝对会成就感满满的,有兴趣的可以将简历发我 daiming@didichuxing.com 或者在微博上联系我 @戴铭