大会前,vina 跟我说 iOS Conf SG 的受众很大,她希望能够讲些可以让大家更加兴奋,可以在日常工作中应用的内容。因此,我也是专门写了些 Demo 和工具,共三个,1,2,3。那些难理解的内容我都去掉了。这次的画的图也是我花费时间最长的一次,学习了些时尚杂志的设计和布局。有些来不及调配色的图,我就参考媳妇买的巧克力包装配色。
下面是分享的内容。视频已放出点击查看。
I’ll be talking about how to reduce app launch times.
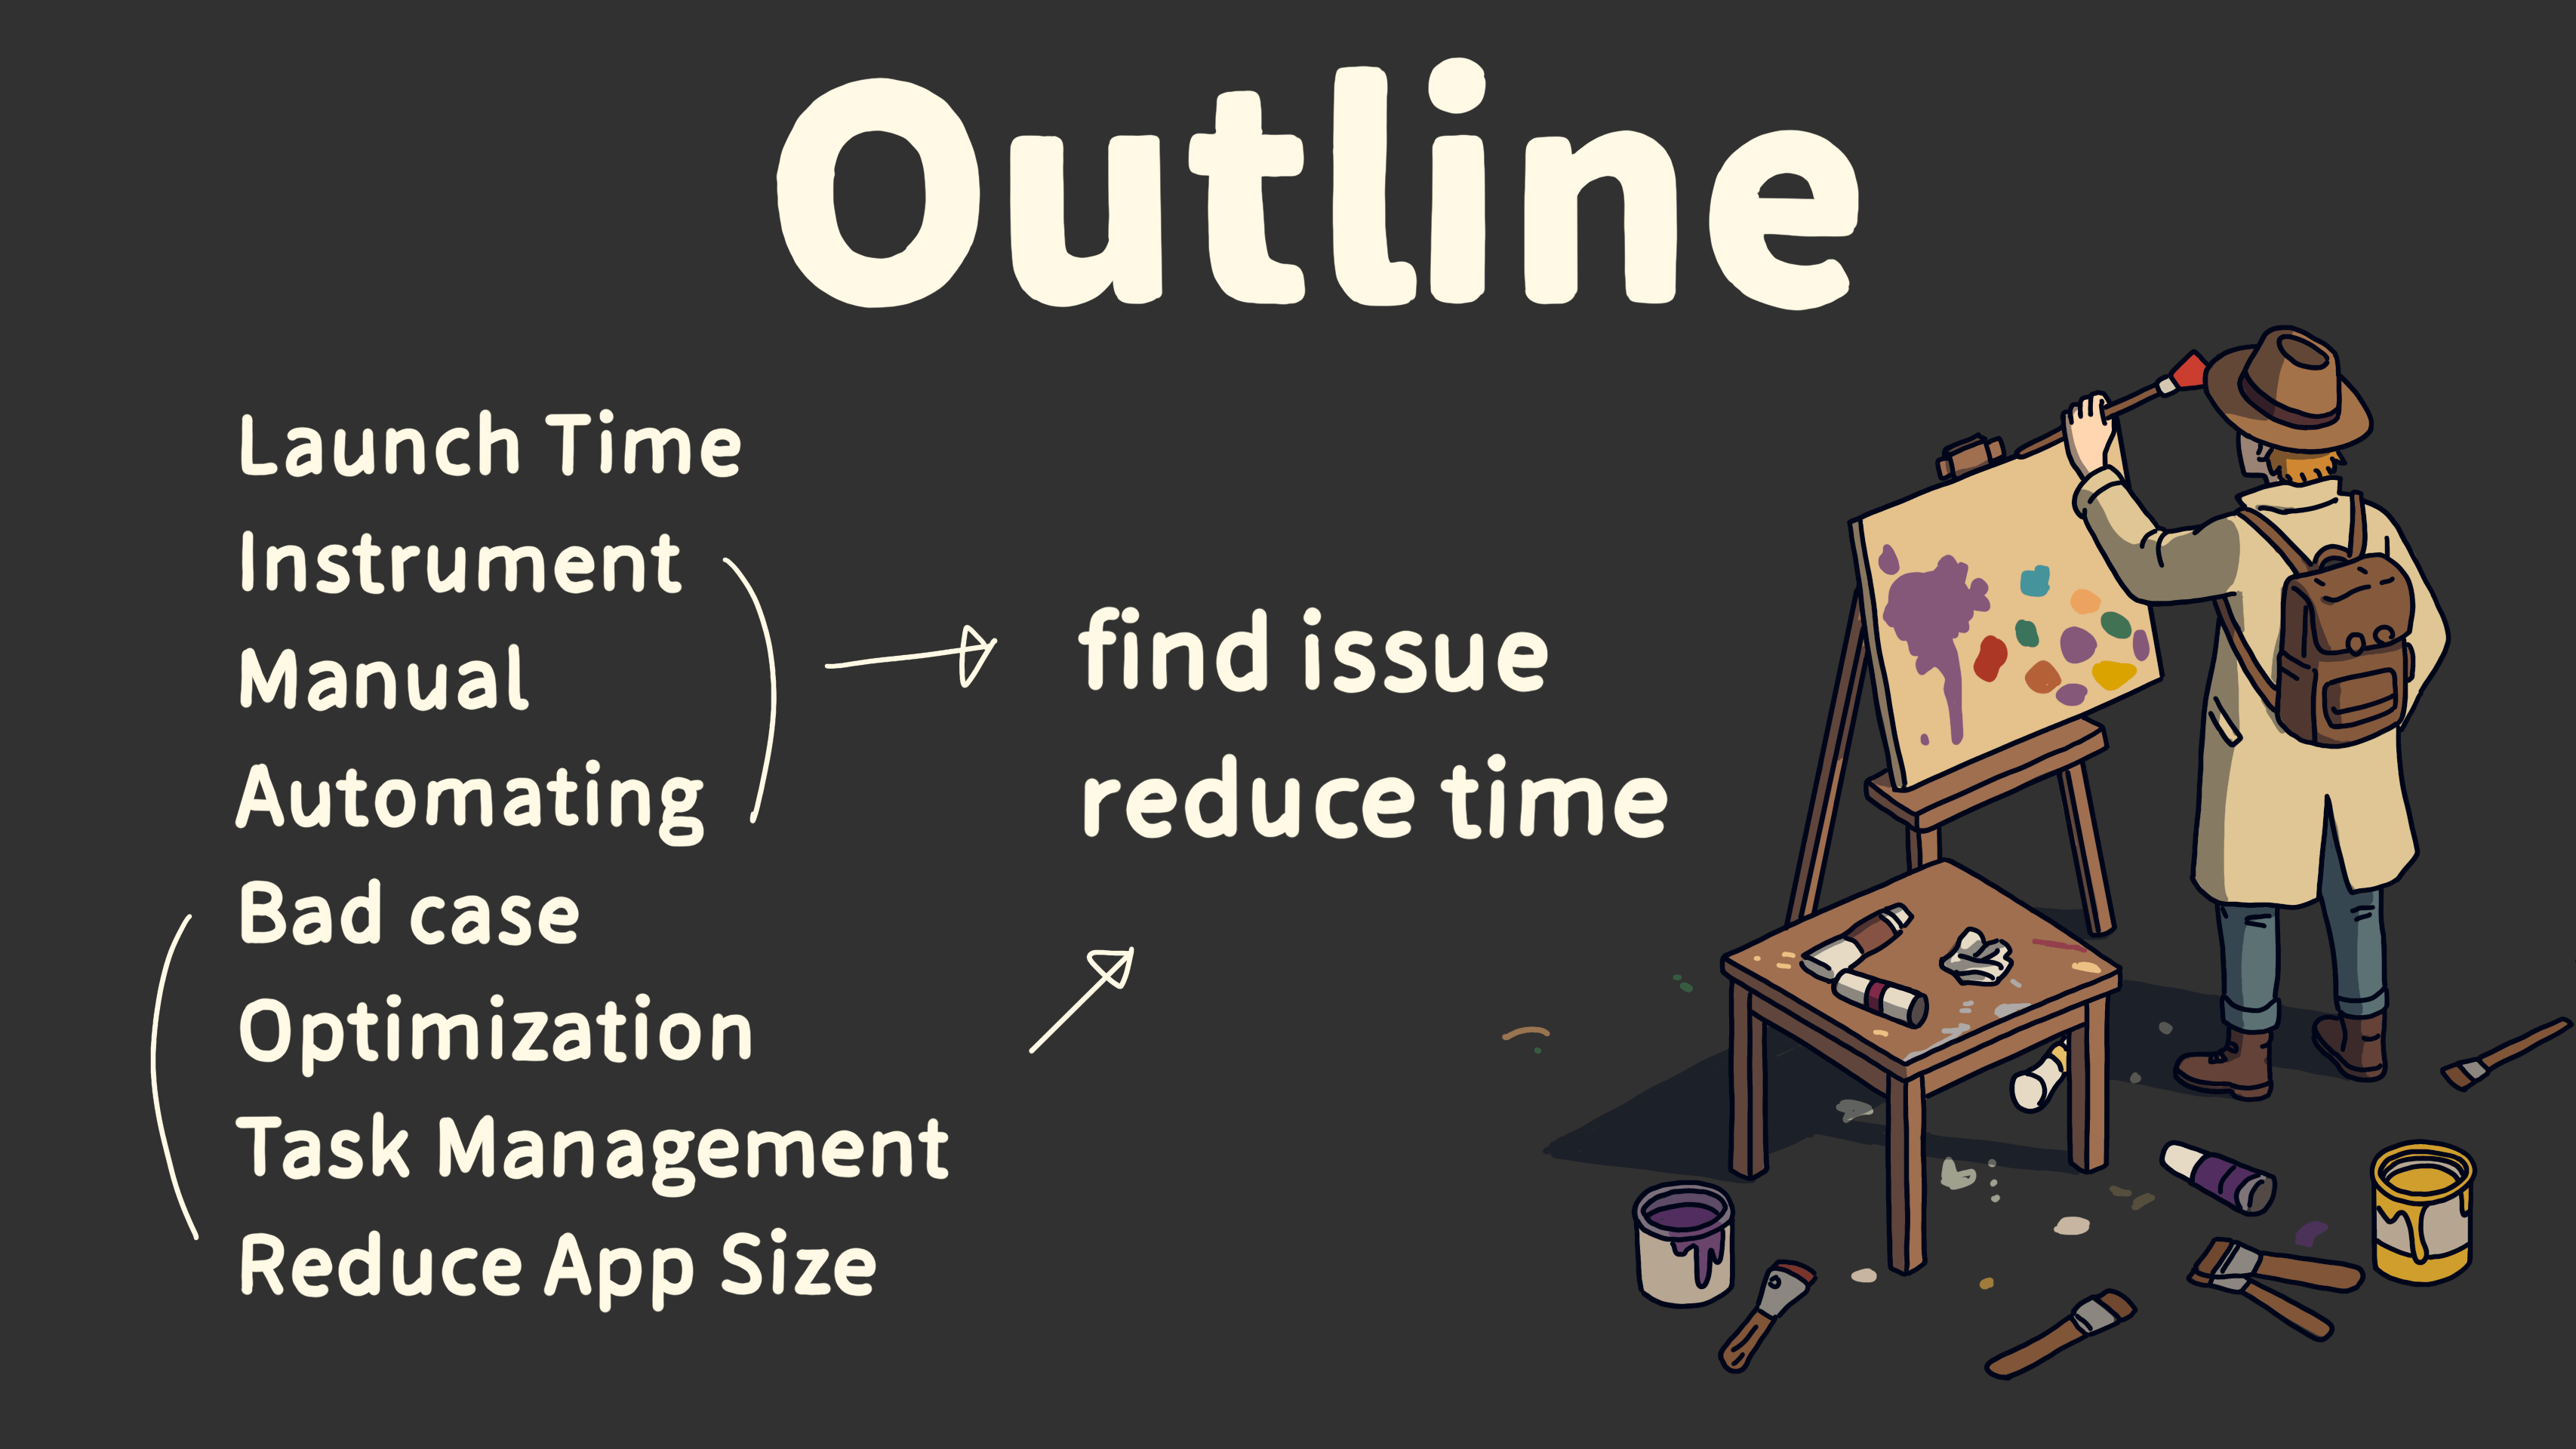
I’ll first explain what app launch time is.
Then, I’ll cover how to collect launch time data using tools like Instruments, os_signpost, sysctl, MetricKit, and by hooking objc_msgSend and Swift functions.
I’ll also go over how to solve common performance issues.
Finally, we’ll dive into advanced ways to reduce launch times, with optimization strategies and code examples.
Let’s first understand launch time.
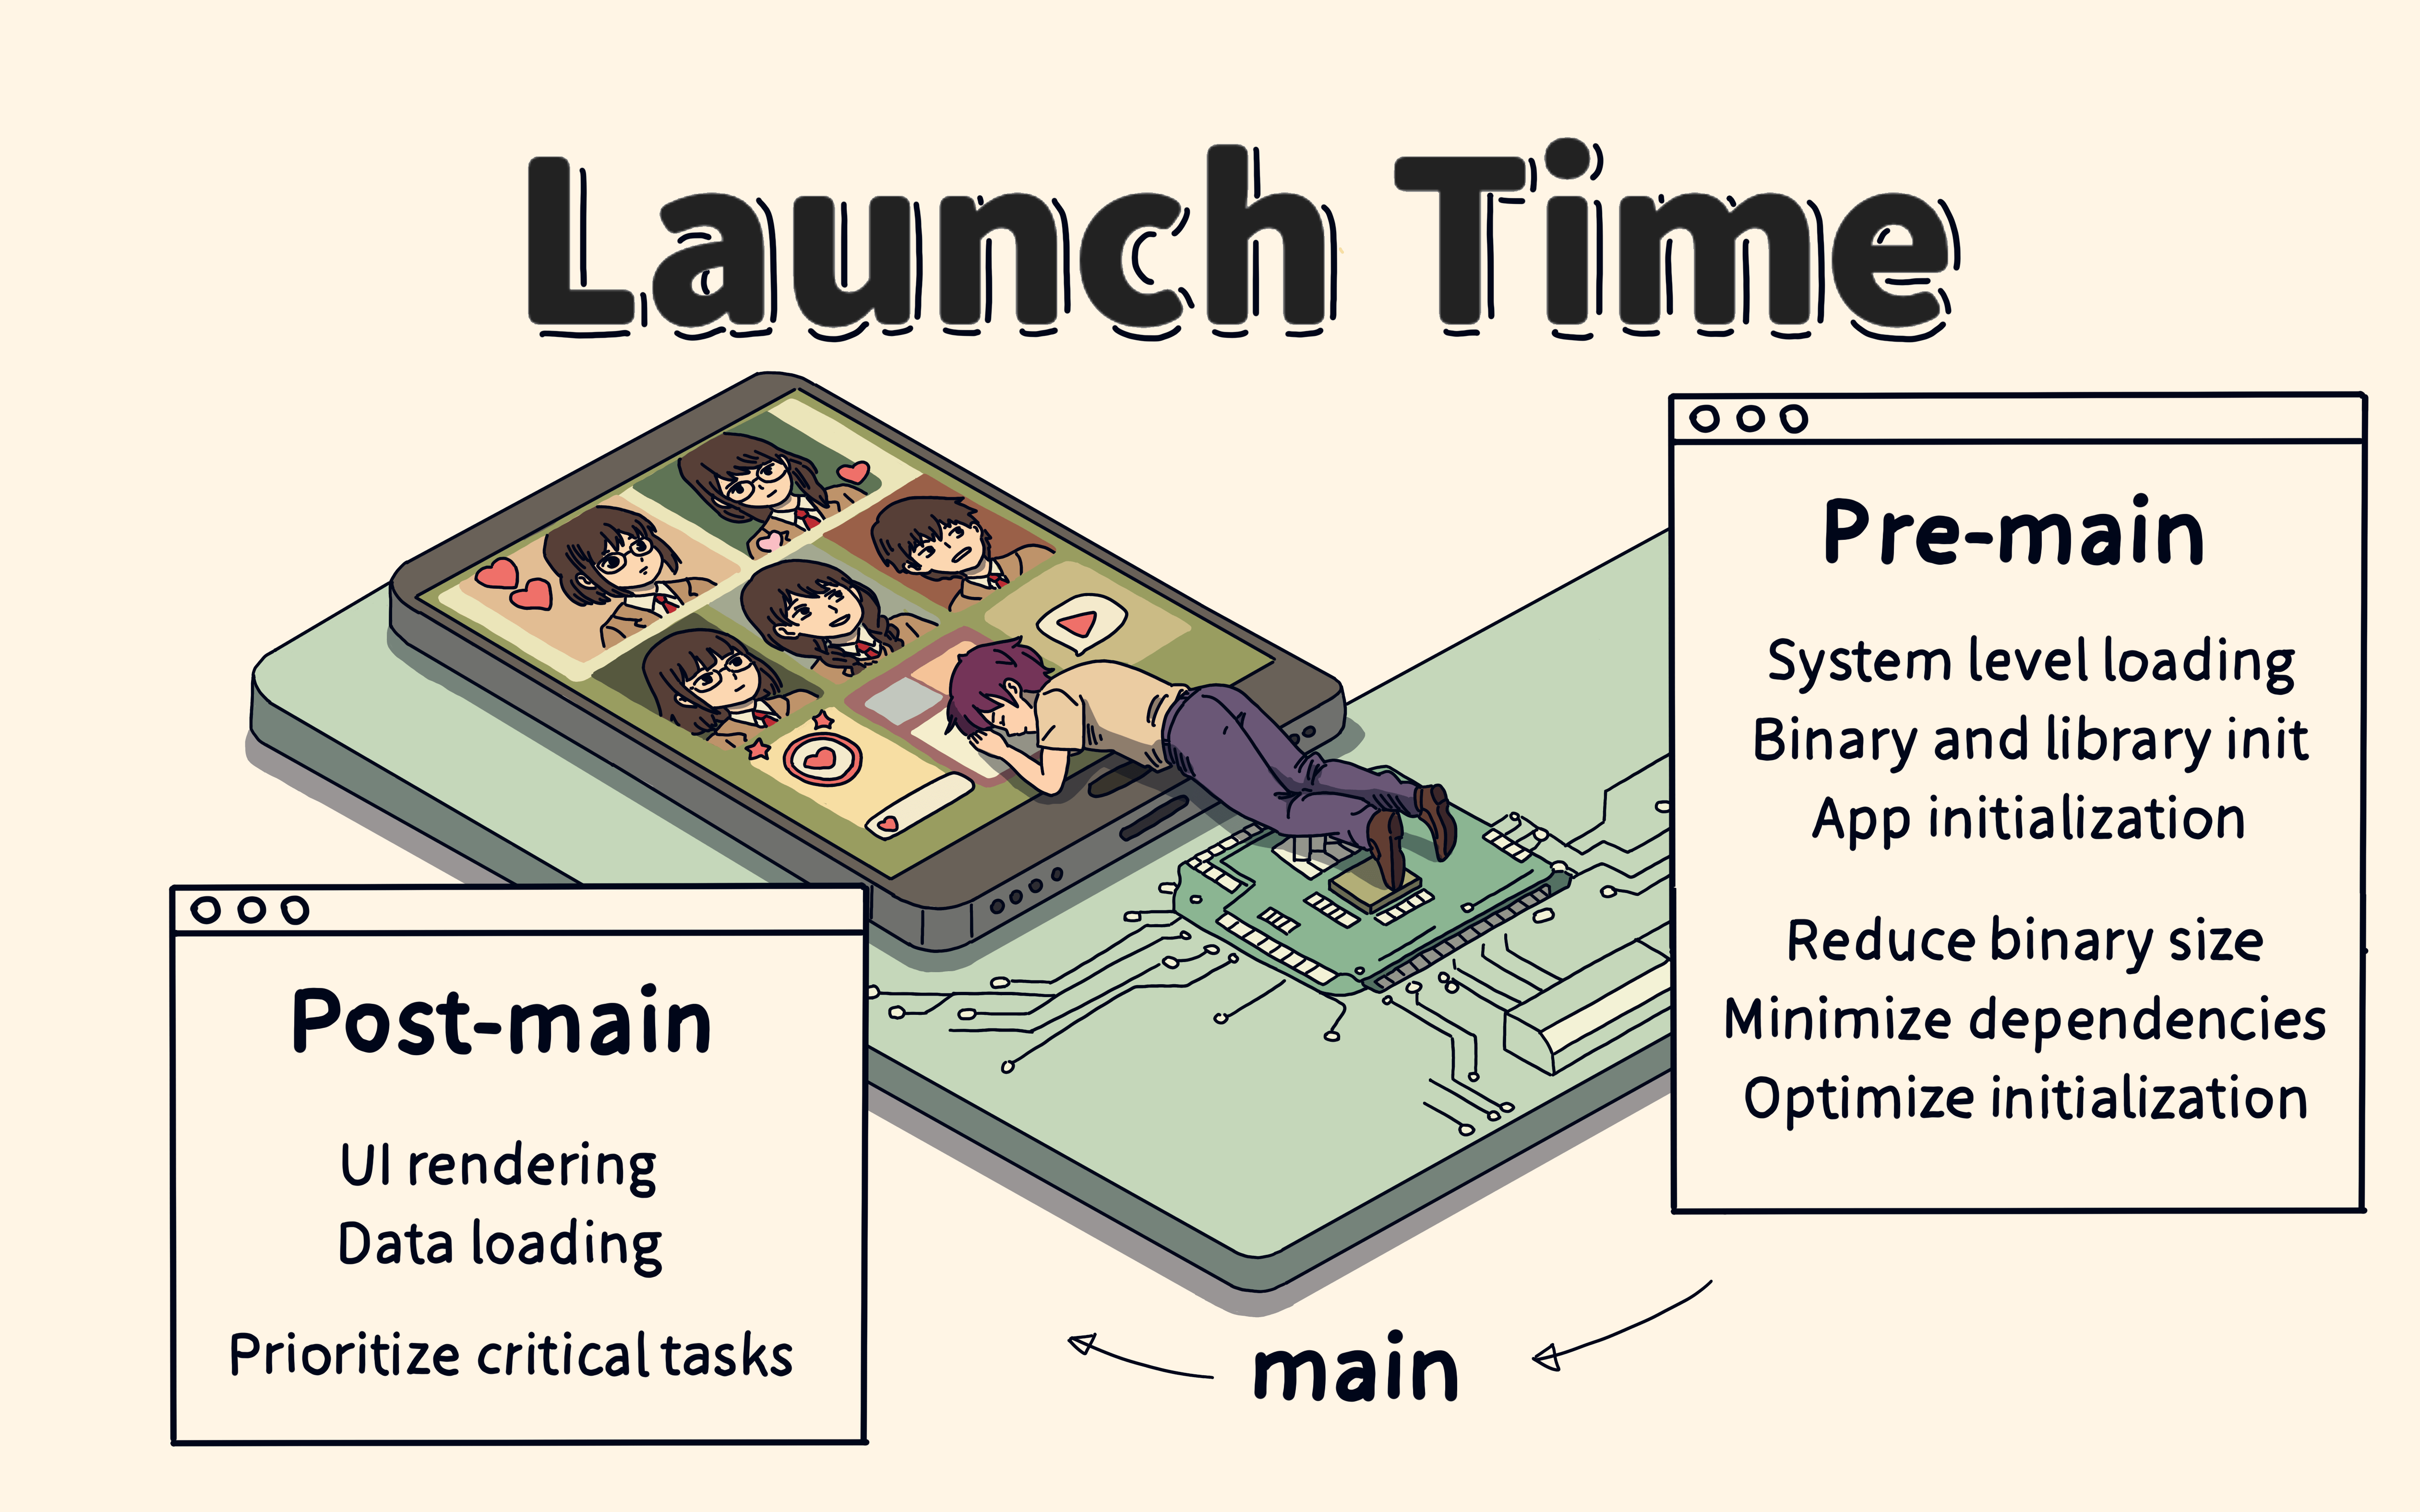
Launch time has two main parts: pre-main and post-main.
Pre-main happens before the
mainfunction. This is when the Mach-O file is loaded and dynamic libraries are read. To optimize here, we can reduce the size of the Mach-O file and cut down the number of dynamic libraries.Post-main happens after the
mainfunction. This is when the UI is rendered and data is loaded until the app becomes interactive. Here, we can optimize task priority.
So, how can we measure the time spent during these stages?

We can use Xcode’s Instruments to analyze launch time.
The method is to use the App Launch template in Instruments, collect data for the first 20 seconds of the app launch, filter the data, and then analyze it.
Since the launch phase calls many system library methods, to get better results, it’s important to filter out system library data and track time usage per thread. Instruments can do this by setting up the Call Tree to filter system libraries and view data by thread.
Keep in mind that Instruments collects data through periodic sampling, so it may miss some details.
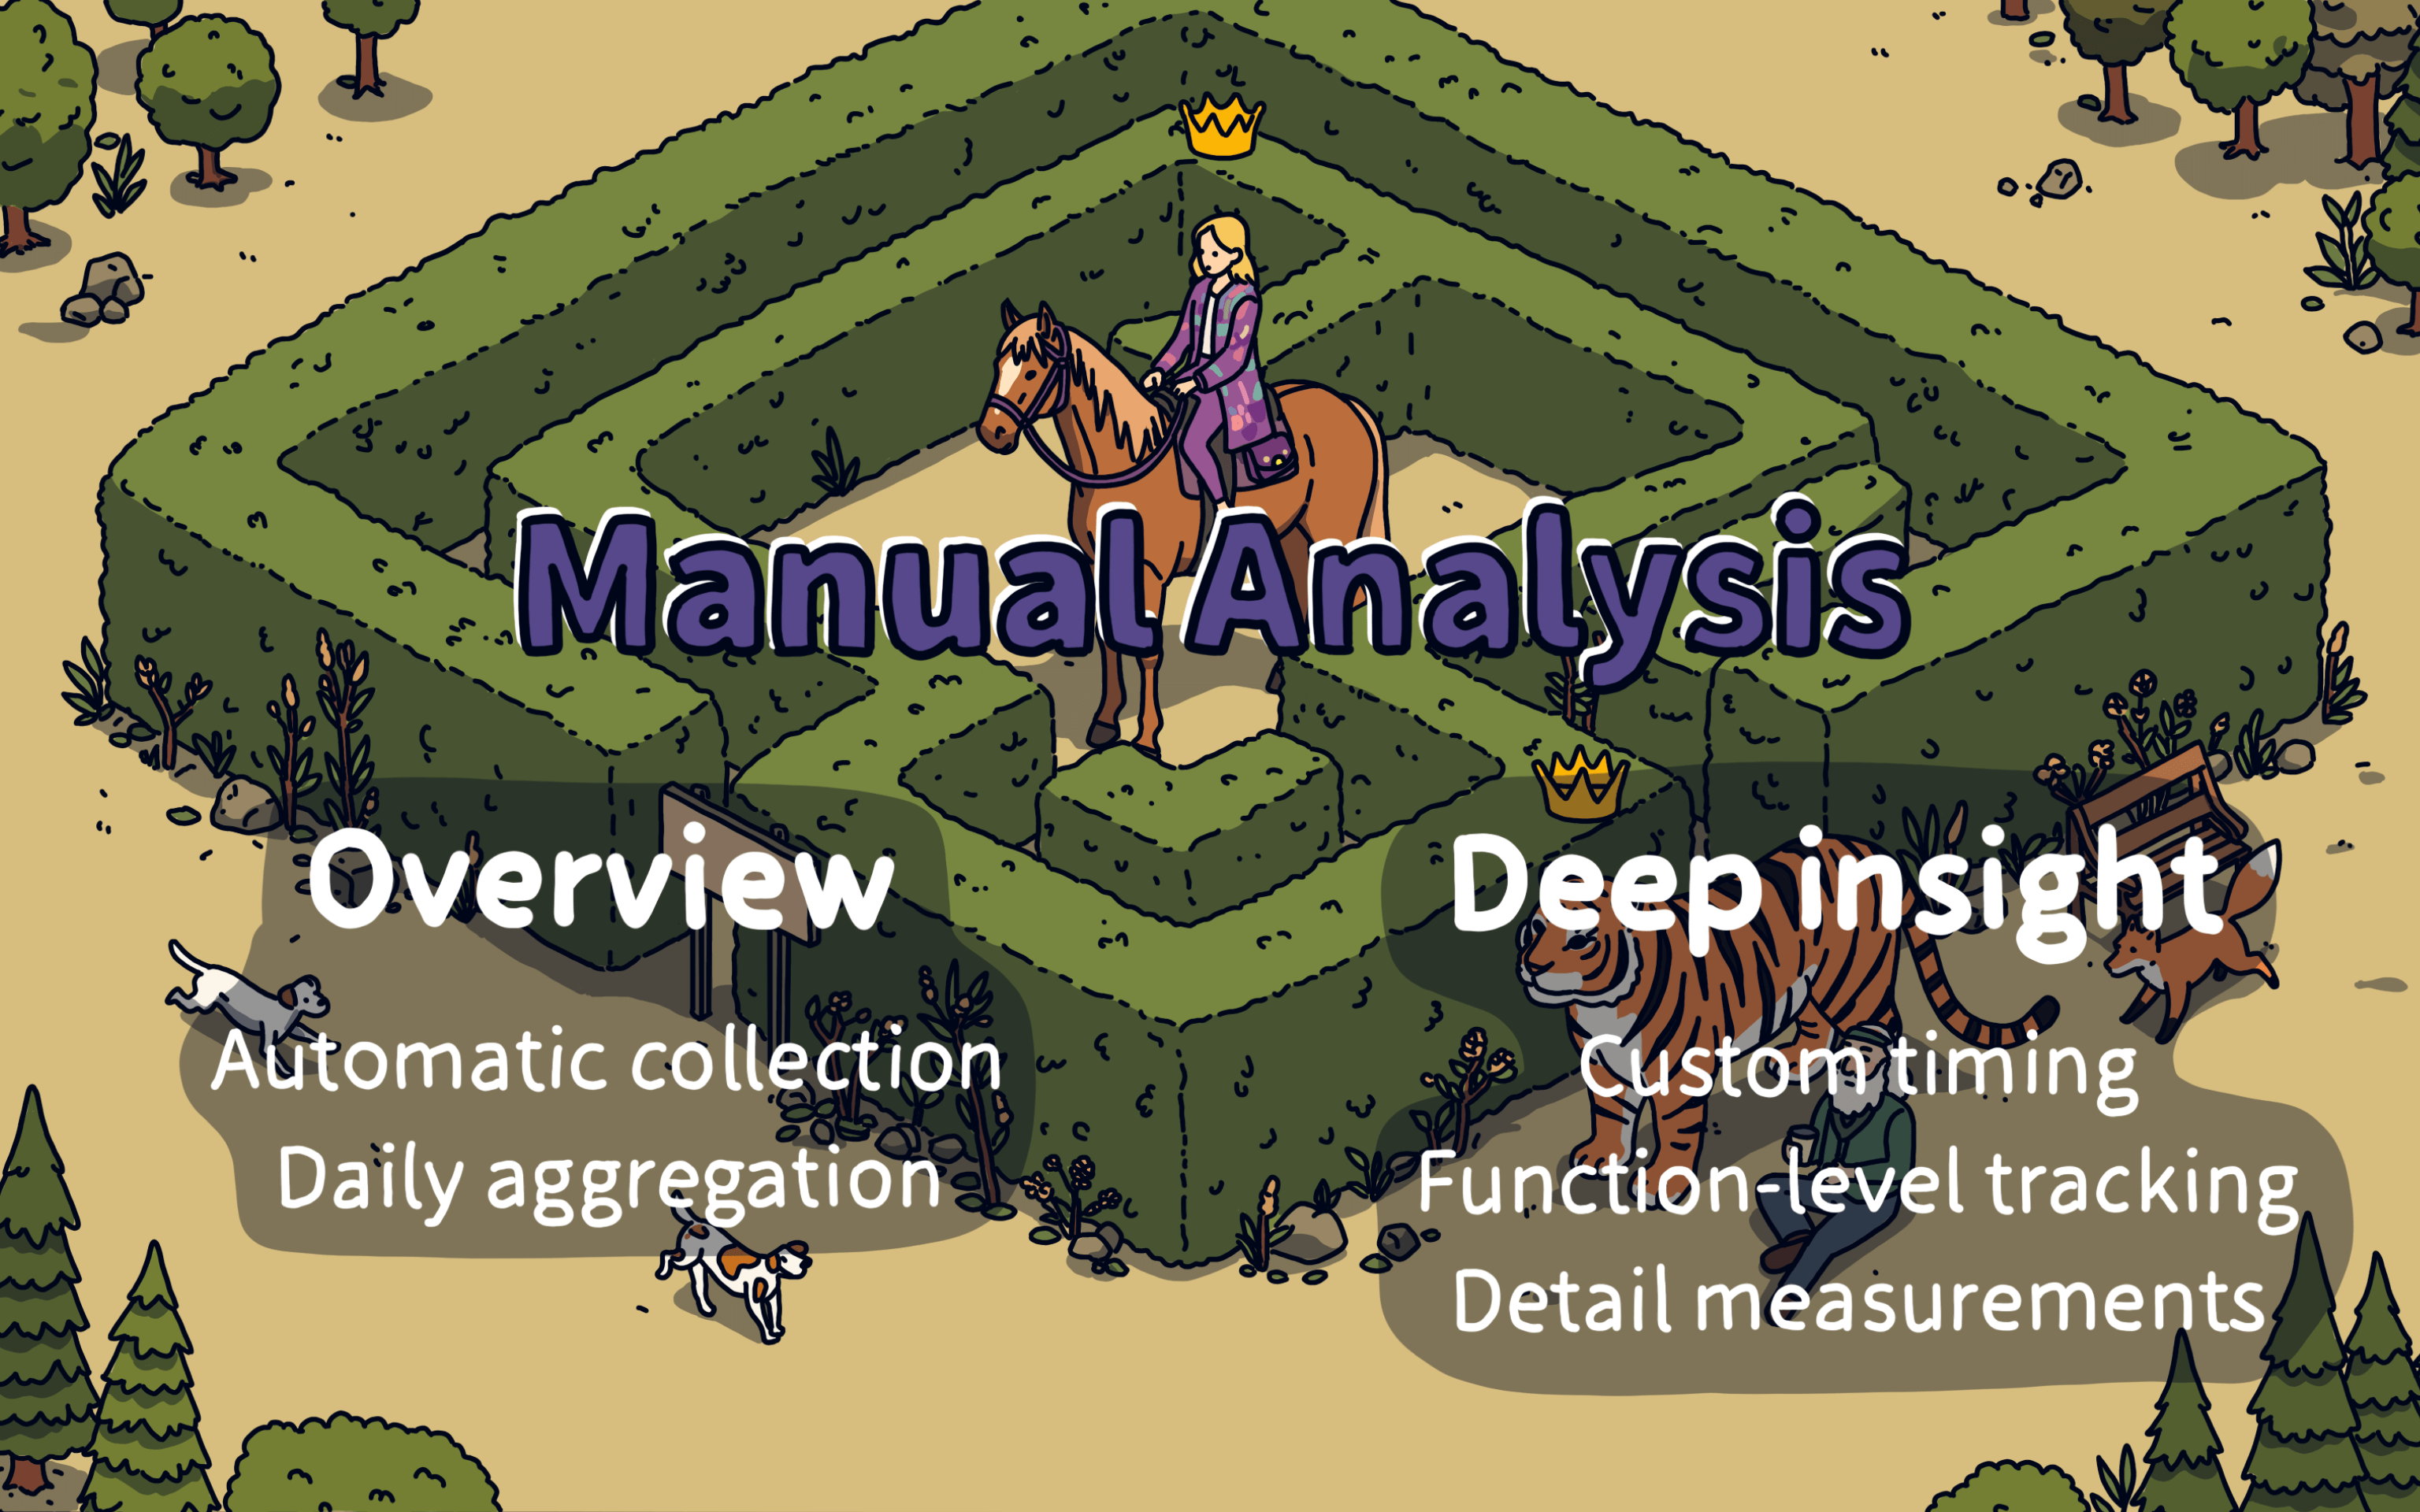
So, we need to do manual analysis. The benefit of this approach is that it lets us collect data automatically, gathering it daily.
It also allows us to customize time tracking, like measuring time at the function level, which gives us more detailed stats.
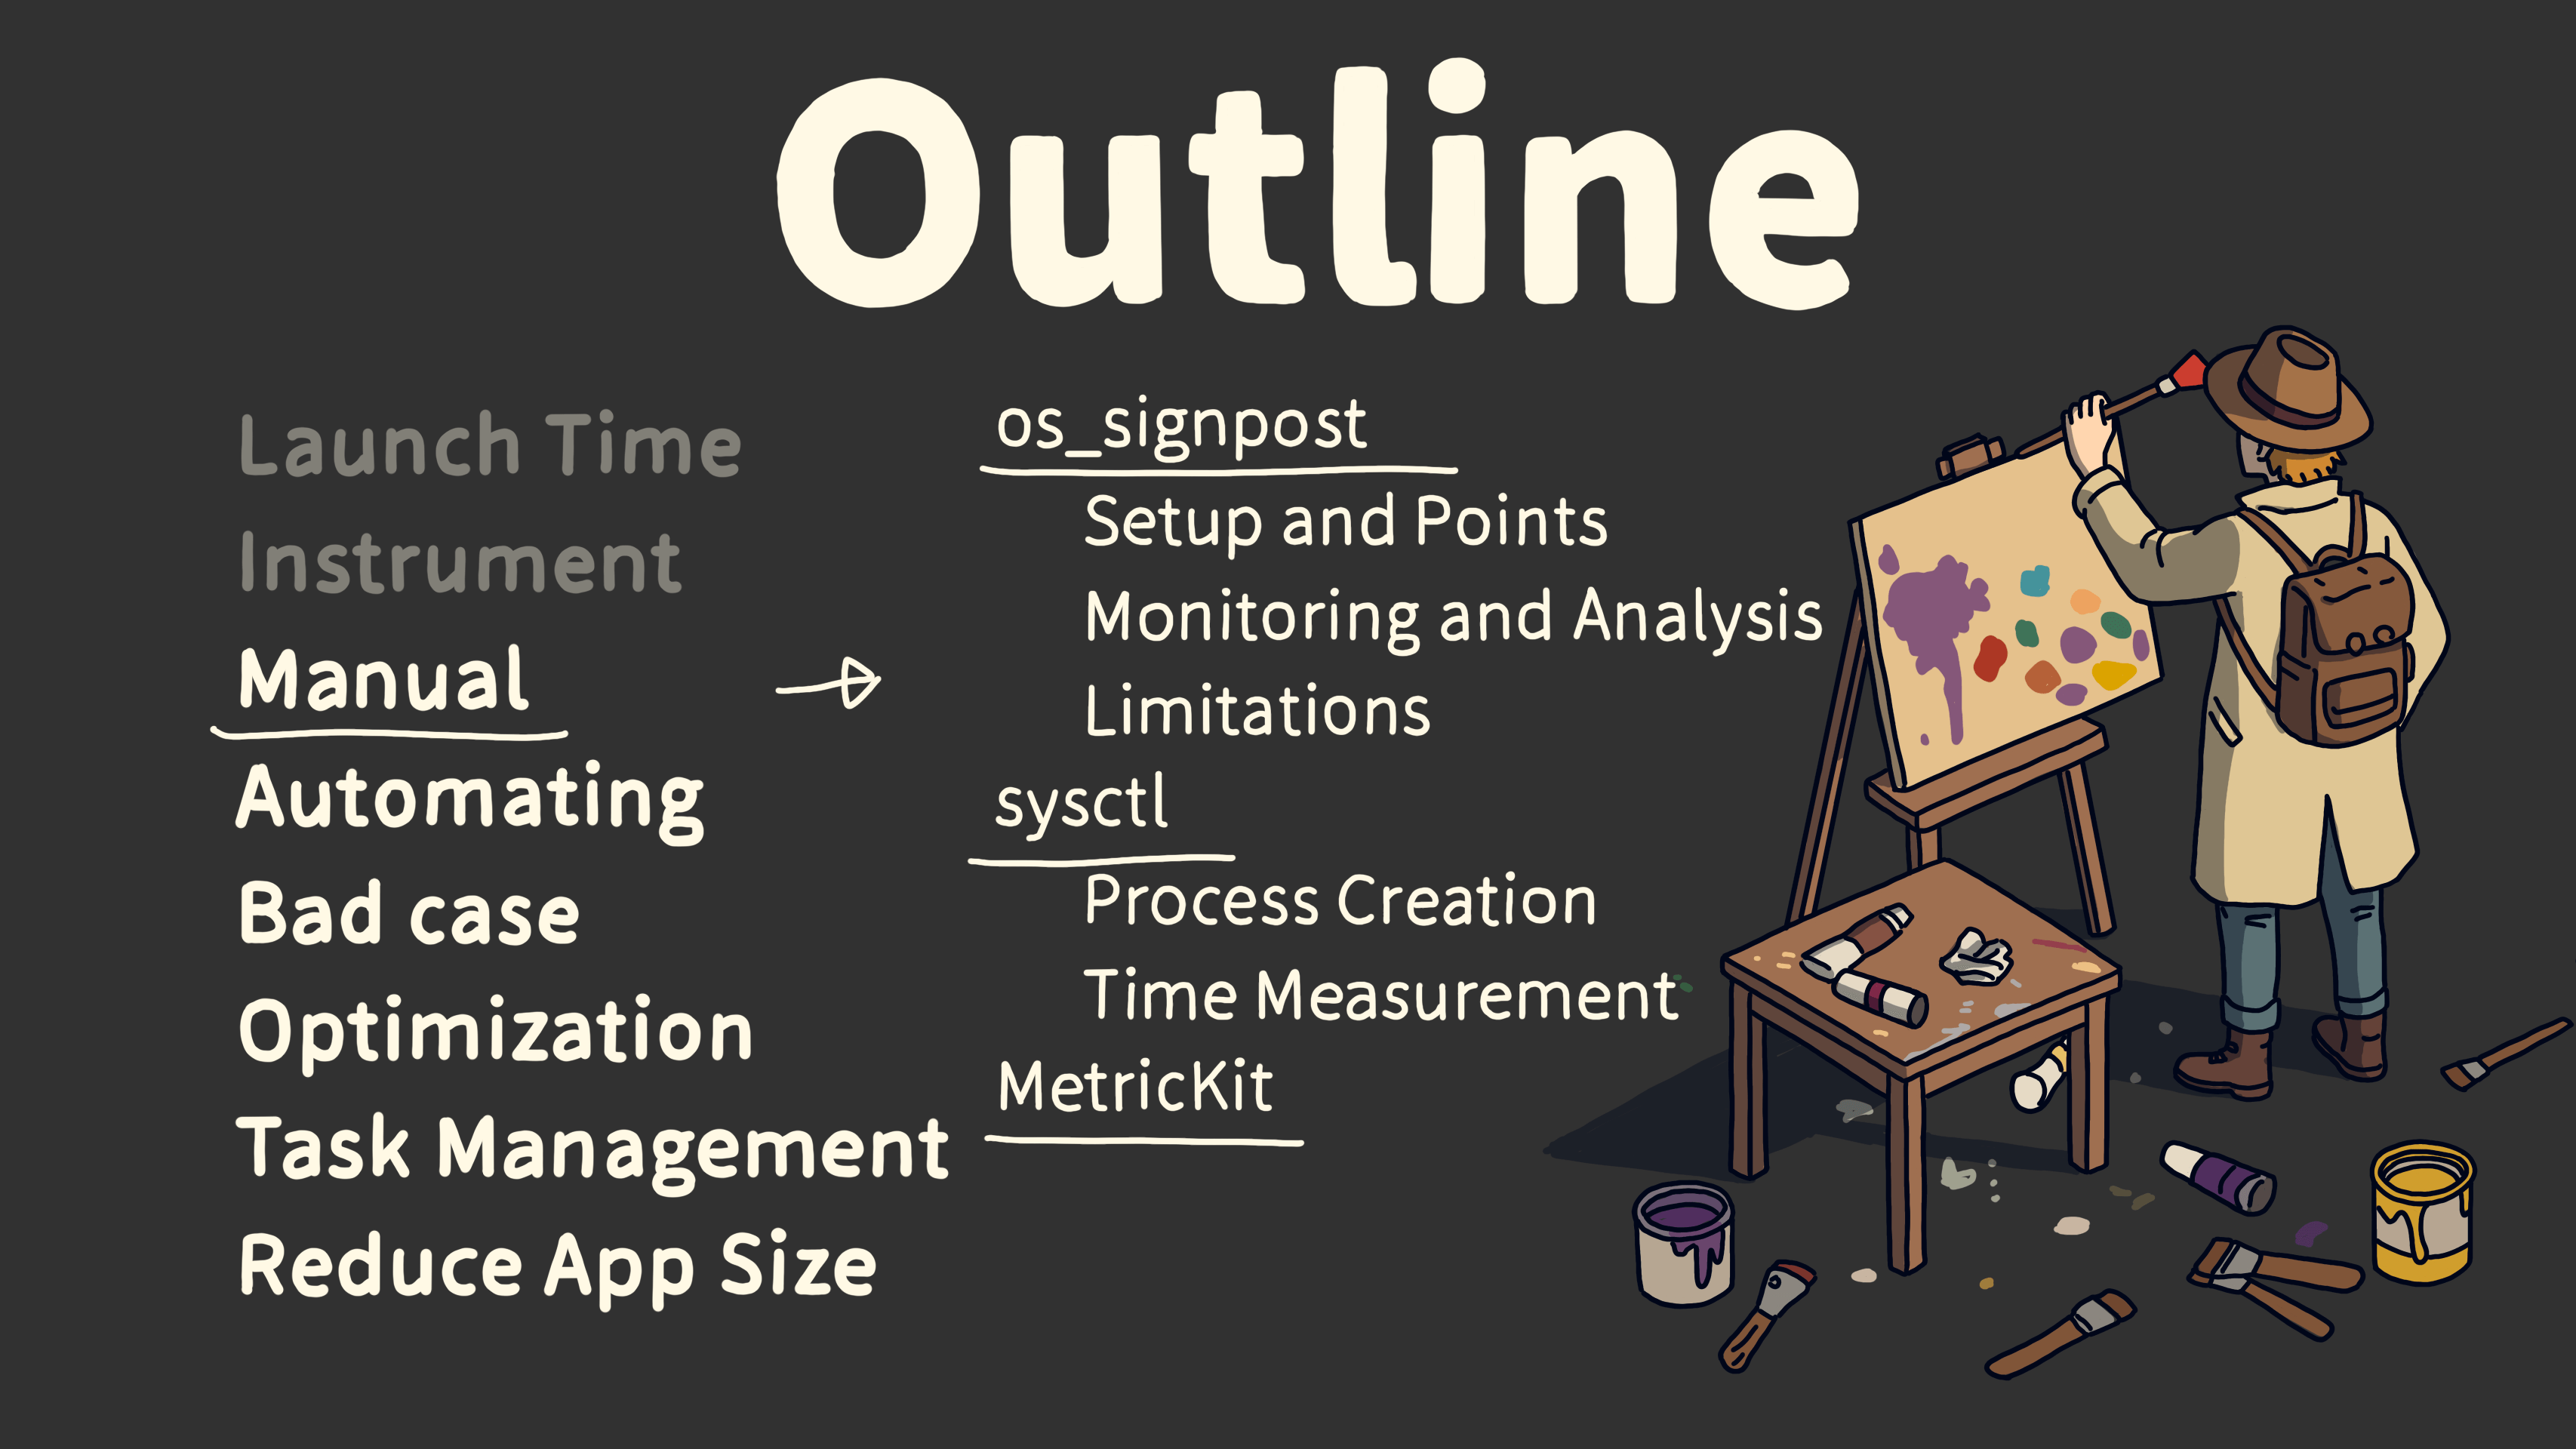
The methods for manual analysis include os_signpost and MetricKit.

Let’s first look at how to use os_signpost.

First, import os.signpost into your code. Then, where you want to track time, add start and end markers to log the duration.
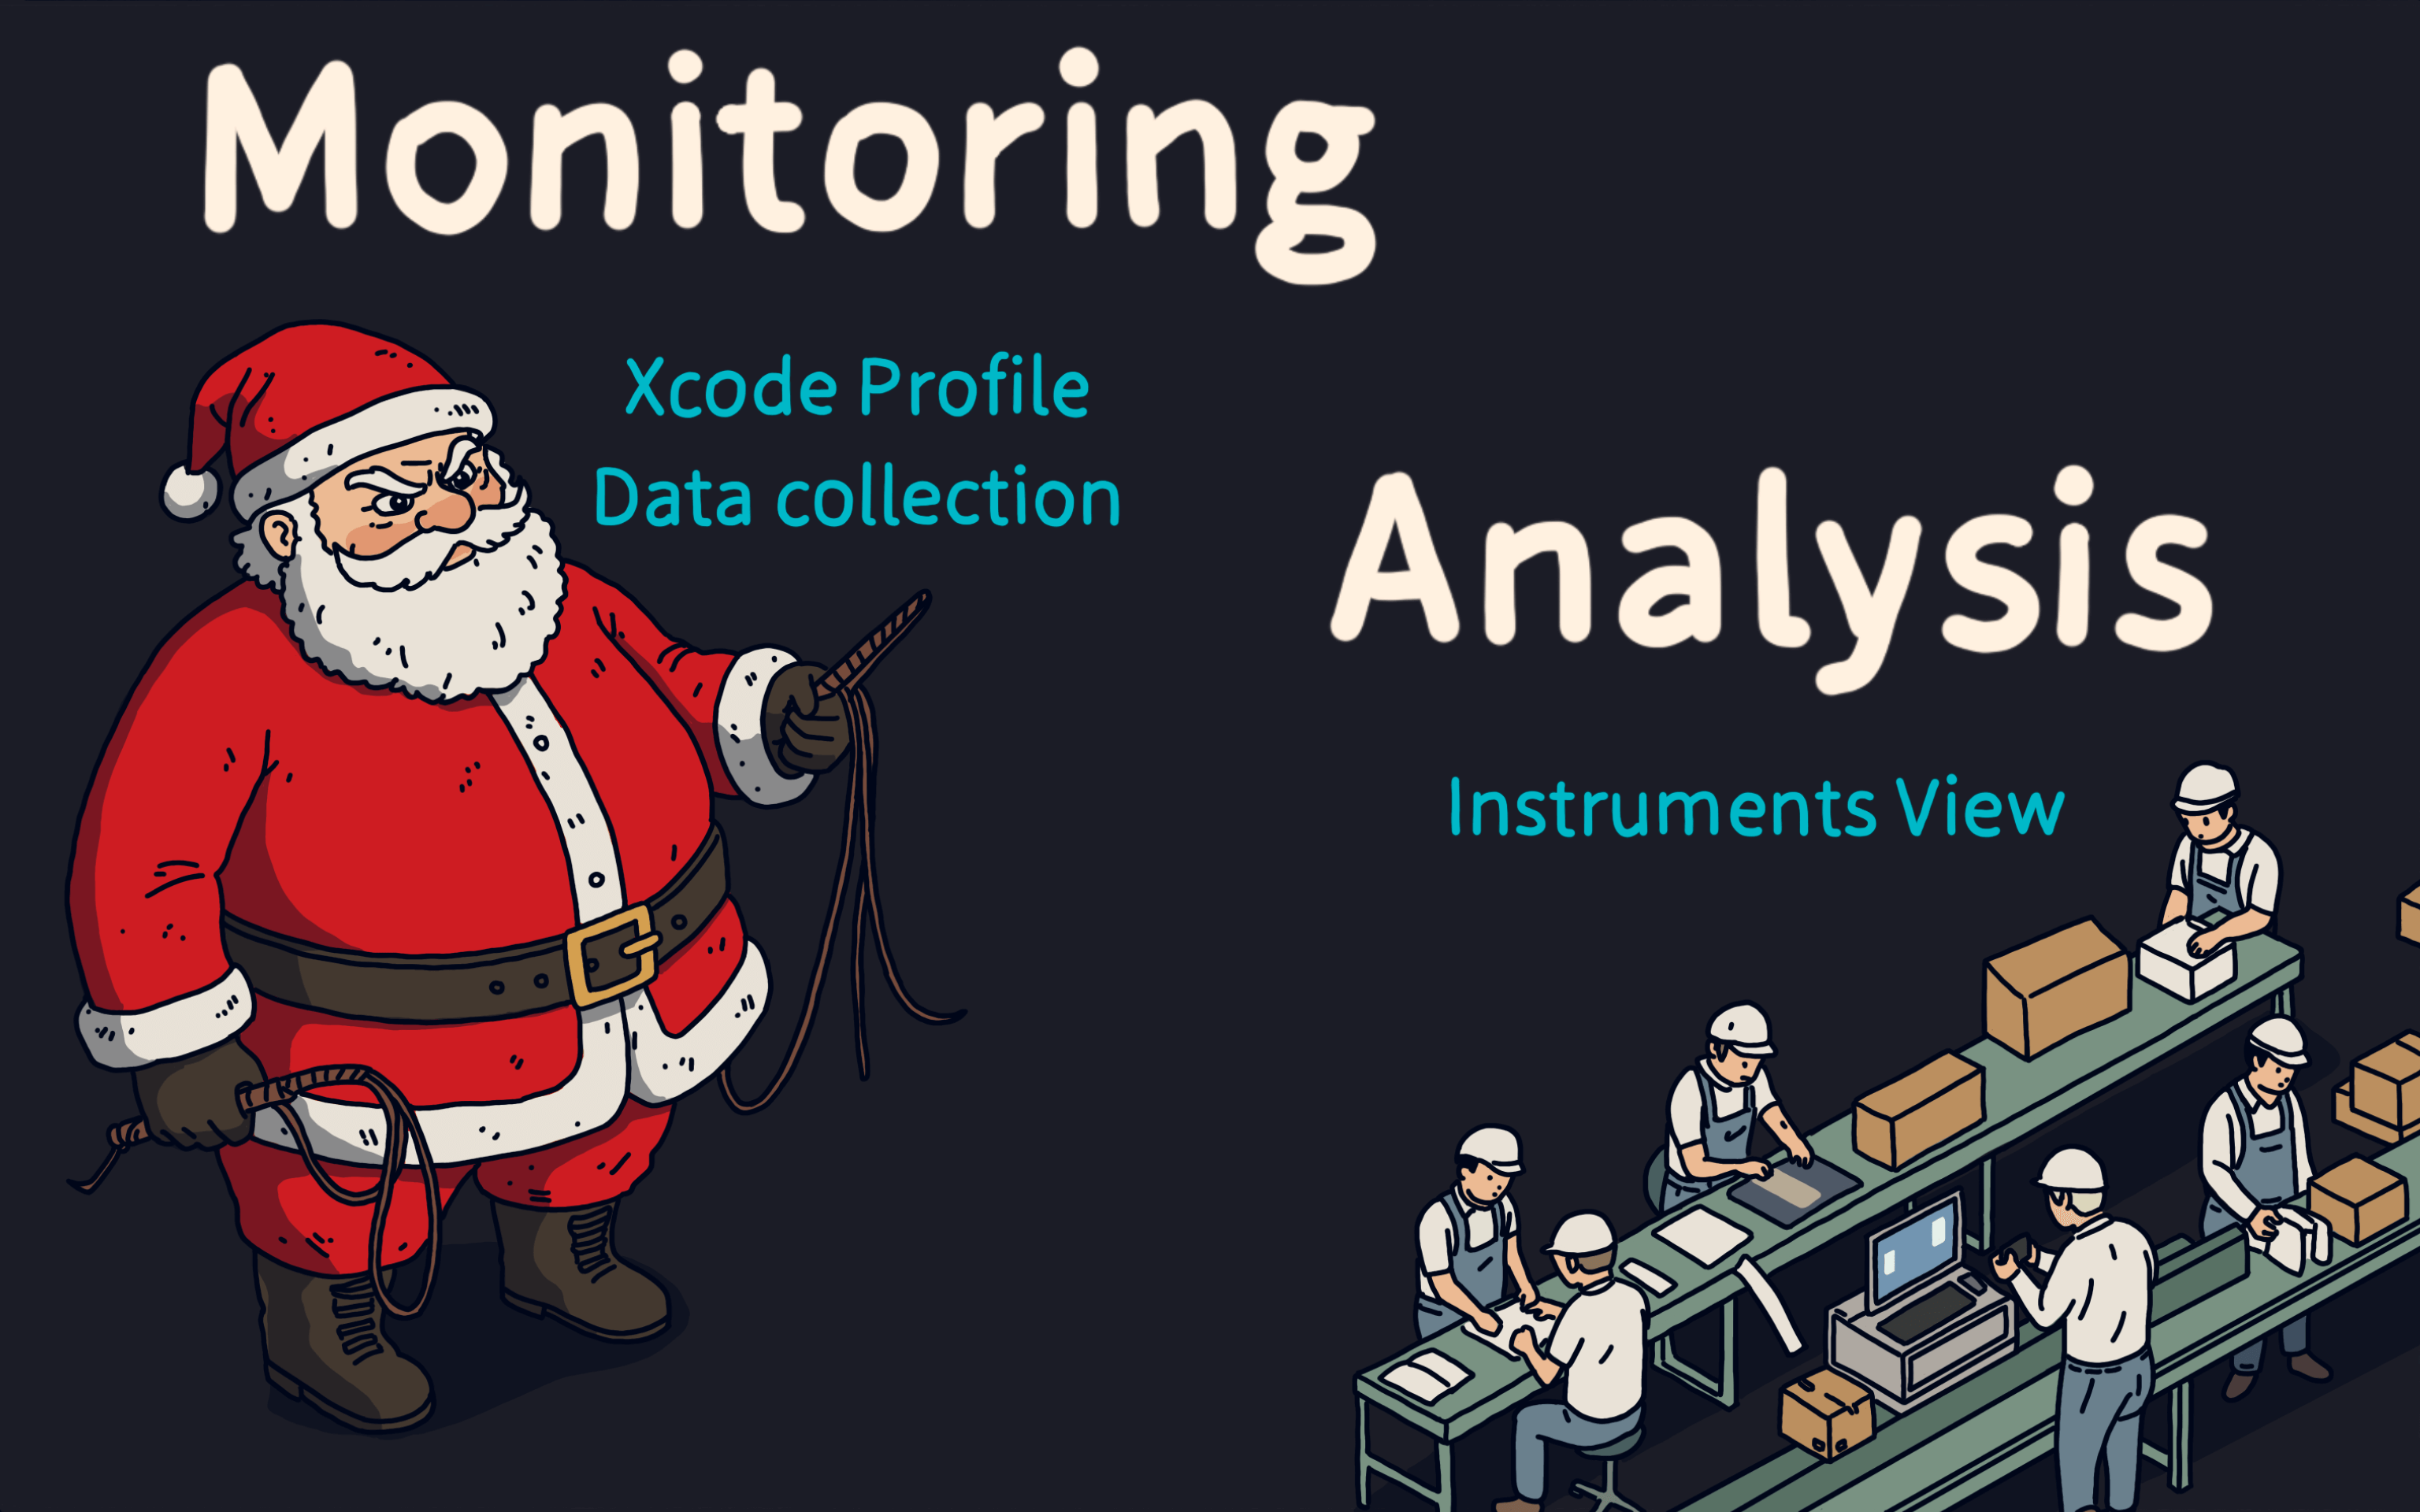
Data collection with os_signpost is done through Xcode’s Profile feature, using the Instrument’s Logging template.
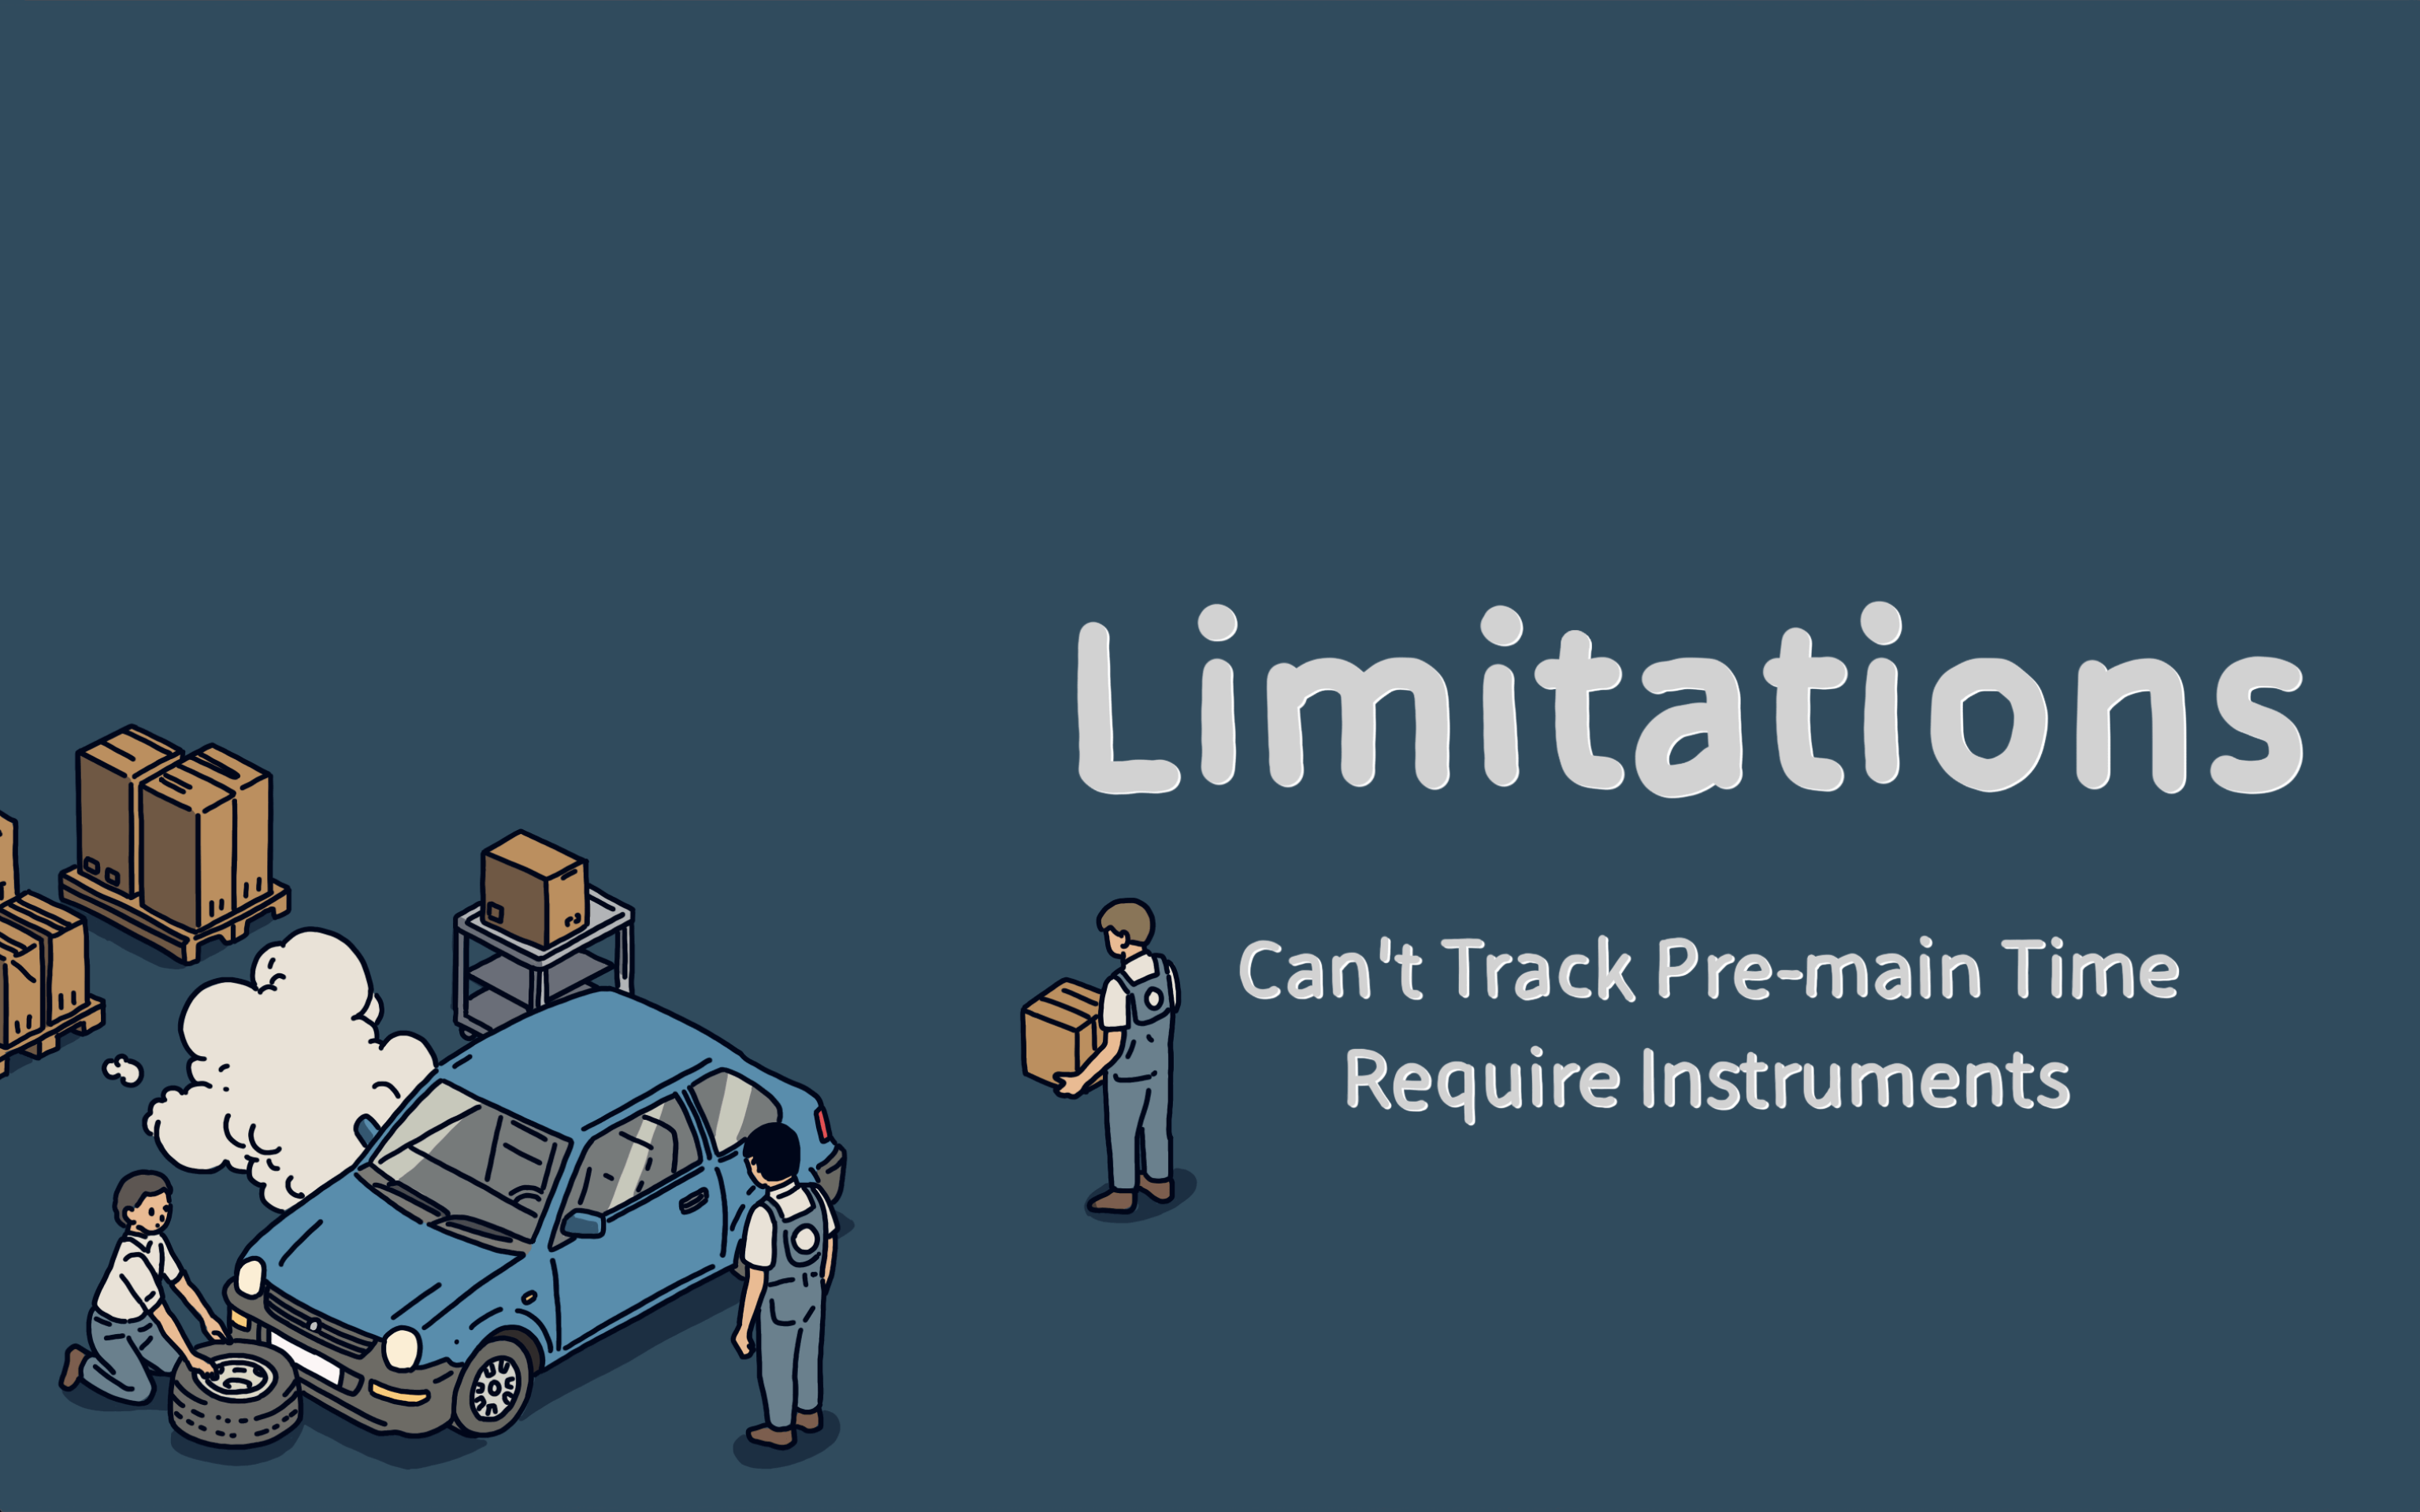
The limitation of os_signpost is that it can’t track pre-main timing. Another limitation is that it still relies on Instruments.
How do we solve these limitations?
To handle this, we can use the sysctl system interface to get pre-main timing.
And with MetricKit, we can gather launch time data without relying on Instruments.
Let’s talk about sysctl. sysctl provides an interface to fetch process information.
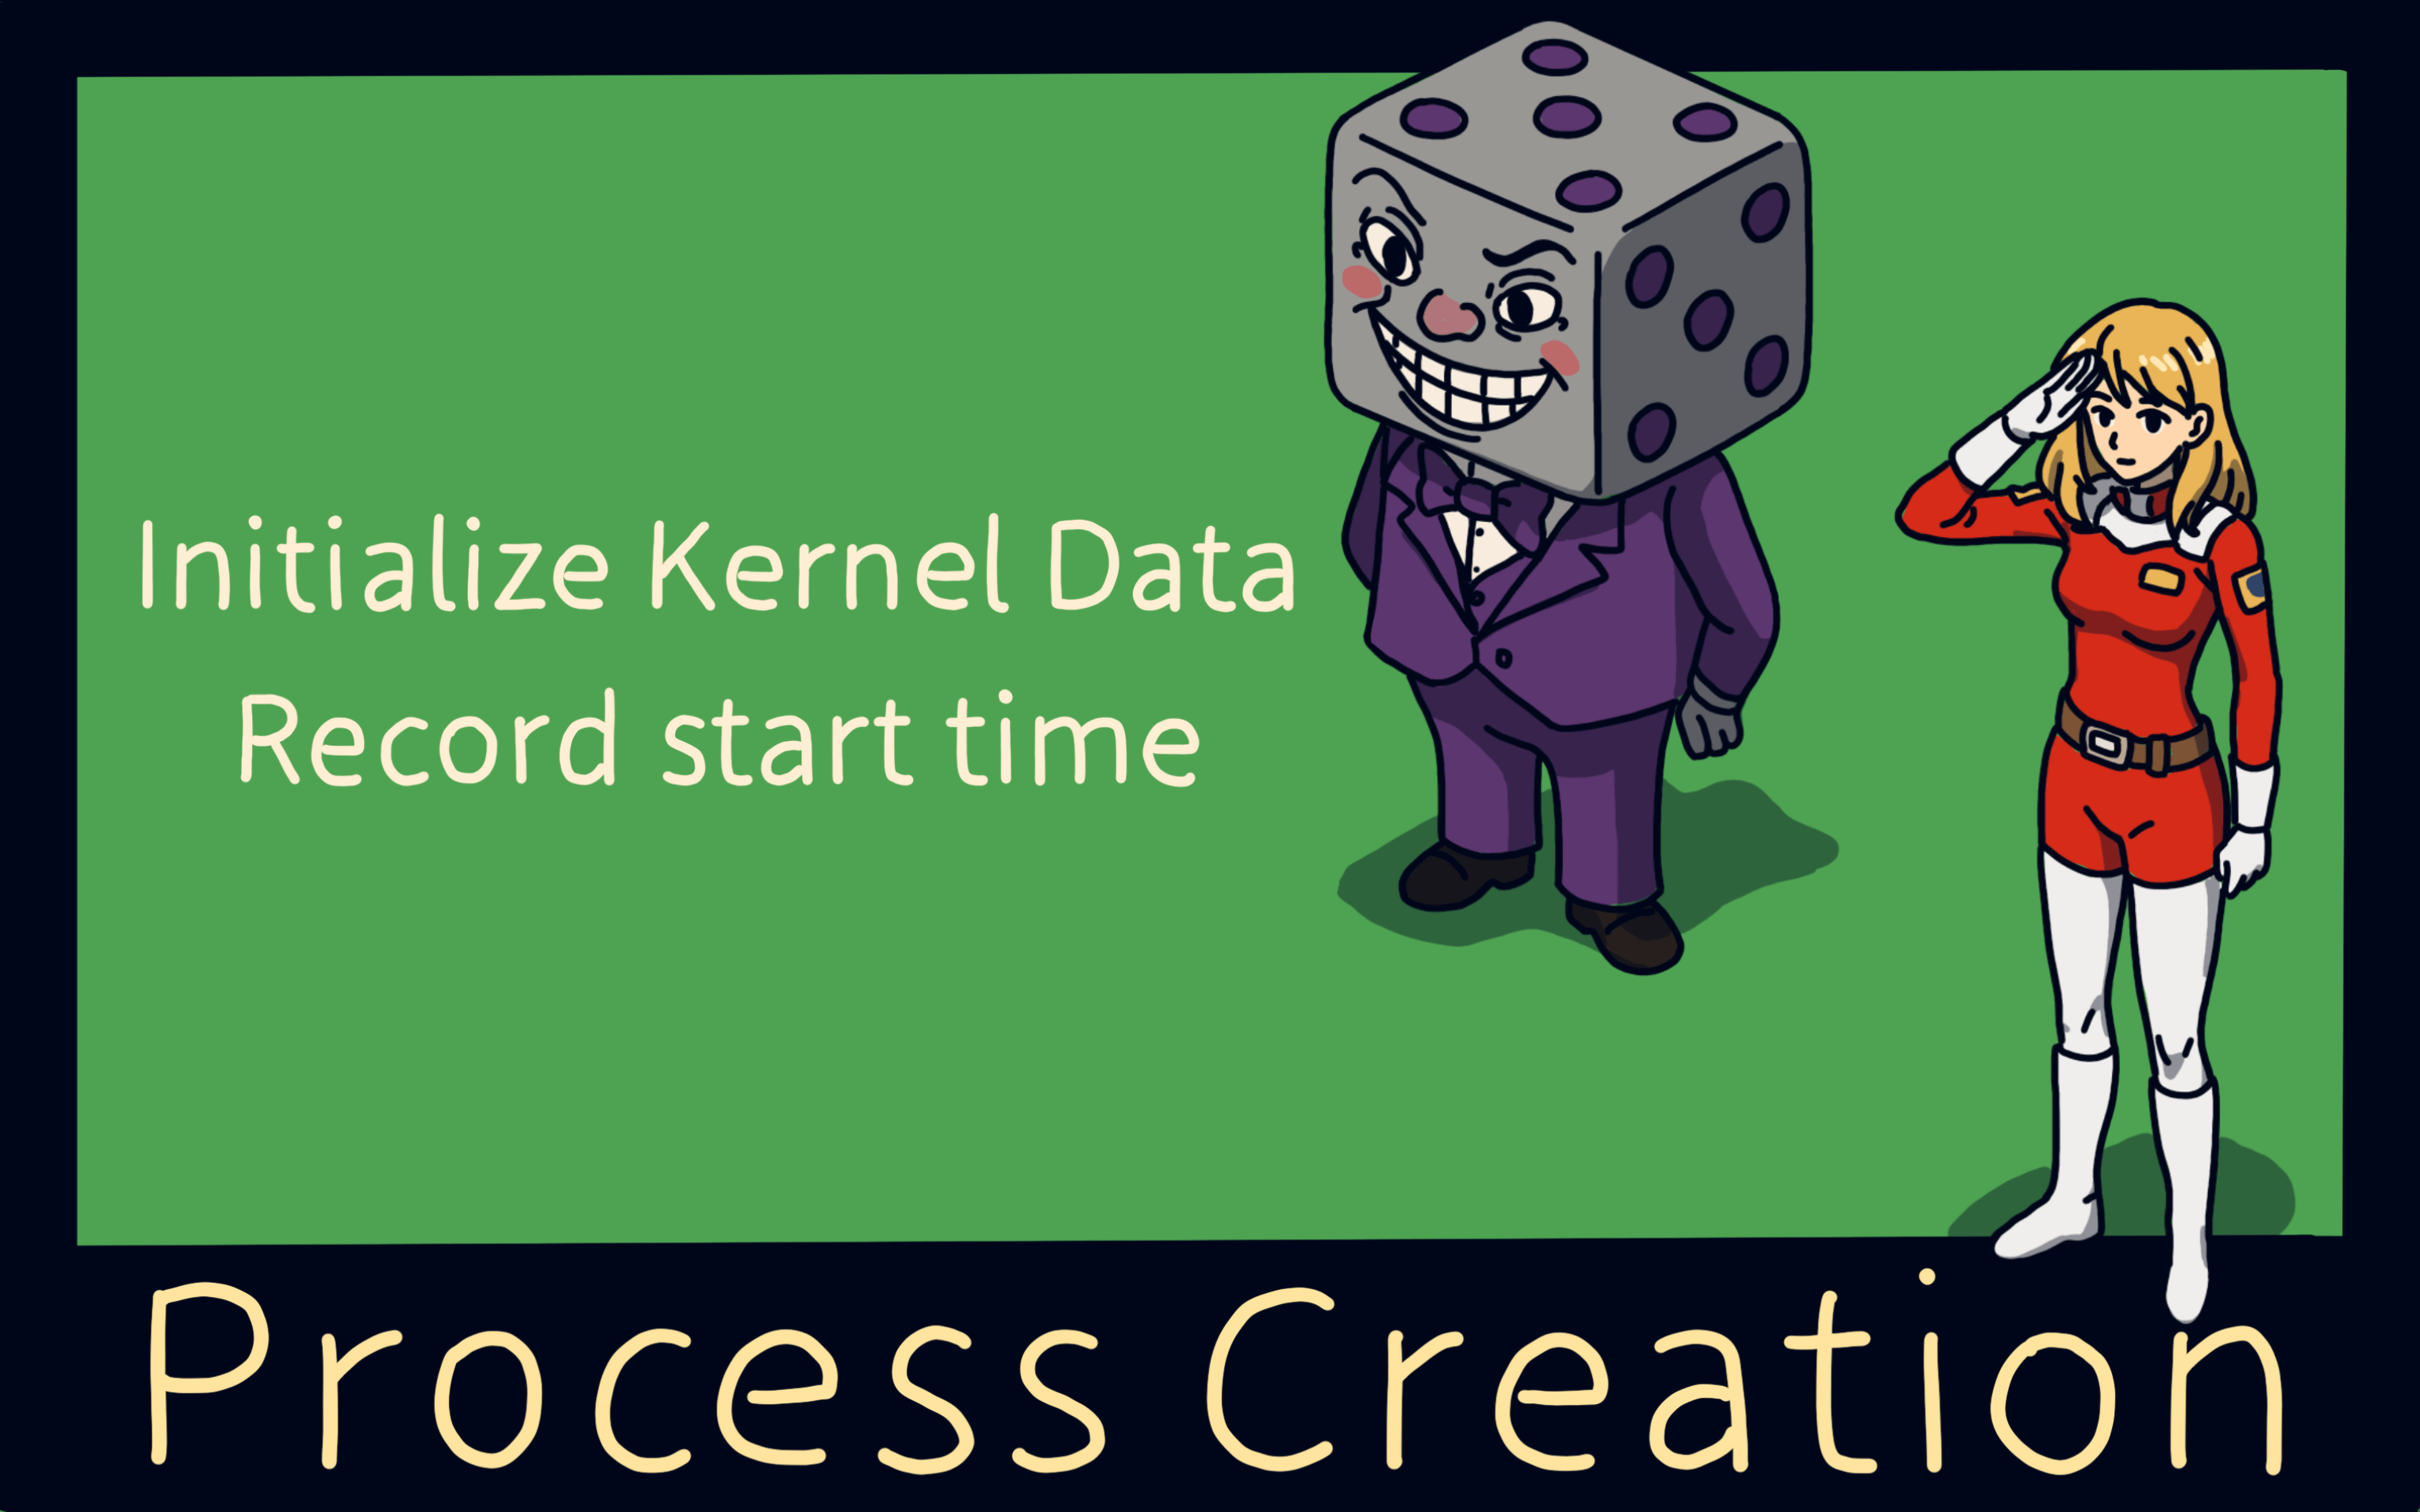
When a process is created, it initializes kernel data and records the creation time. This is the start time of the process.
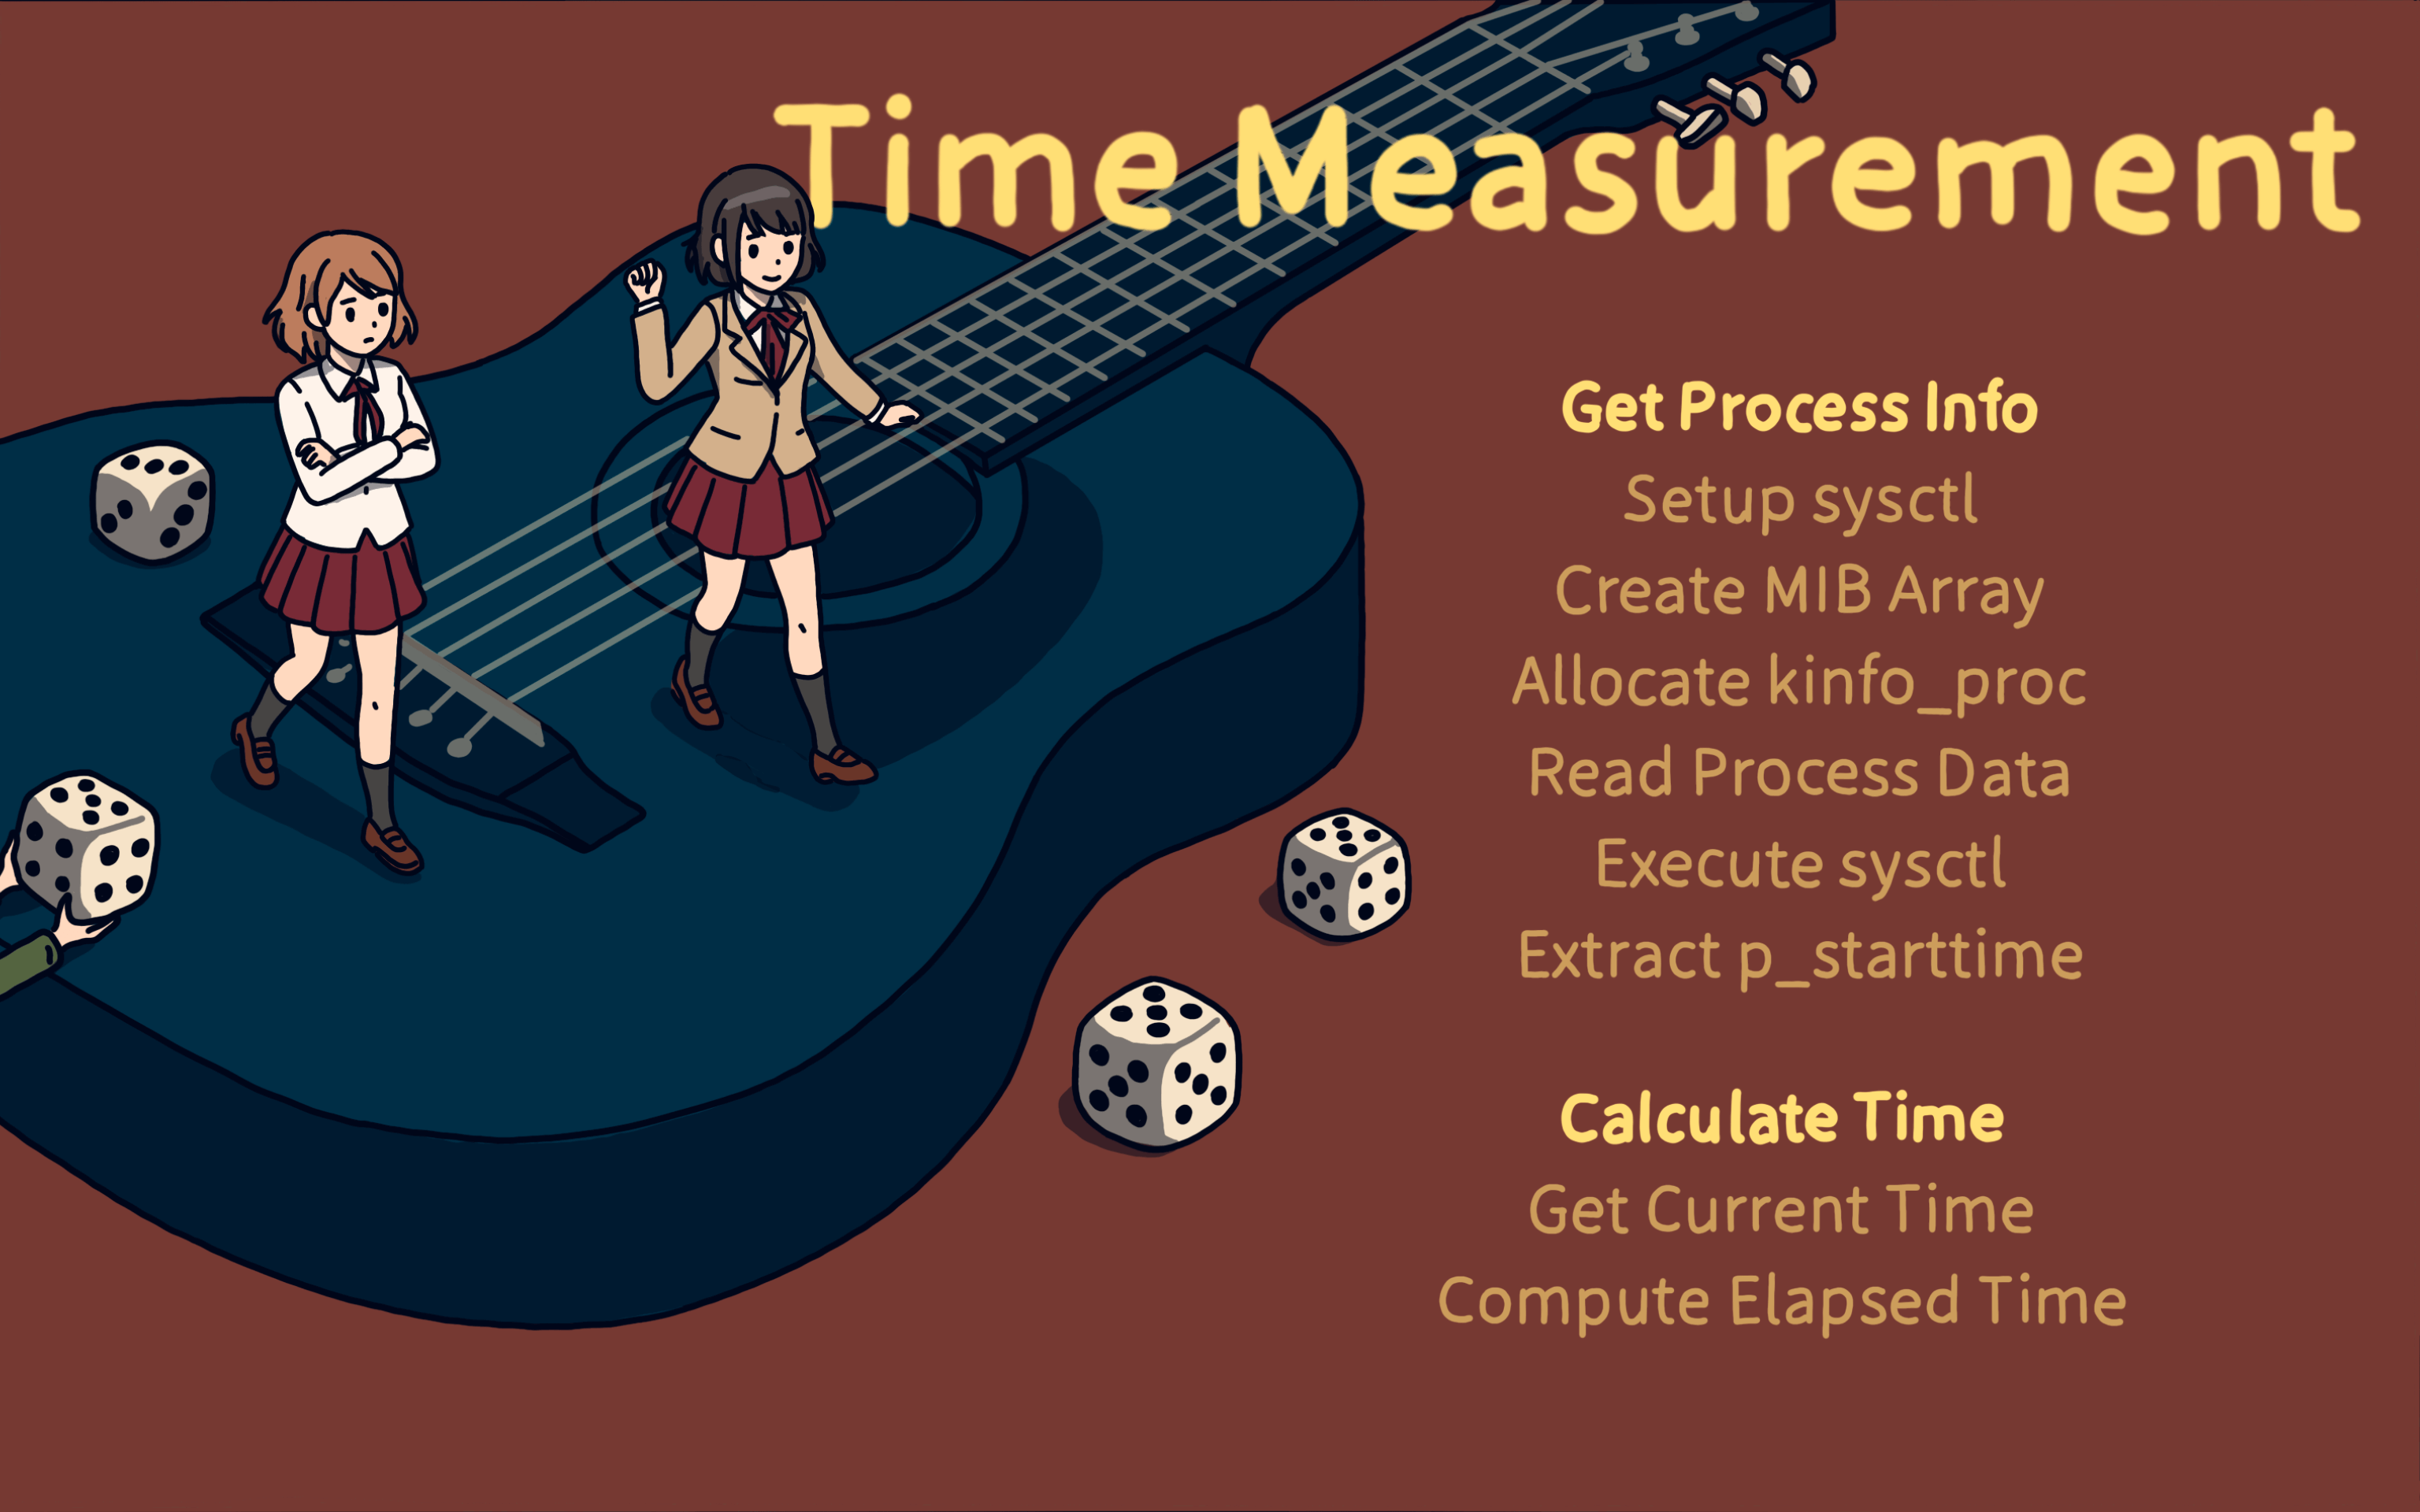
To measure time with sysctl, we first get process info and then calculate the elapsed time.
We do this by setting up sysctl, creating an MIB array, and getting the p_starttime value from the kinfo_proc structure.
The p_starttime gives us the process start time. To get the elapsed time, we need the current time and then calculate the difference.
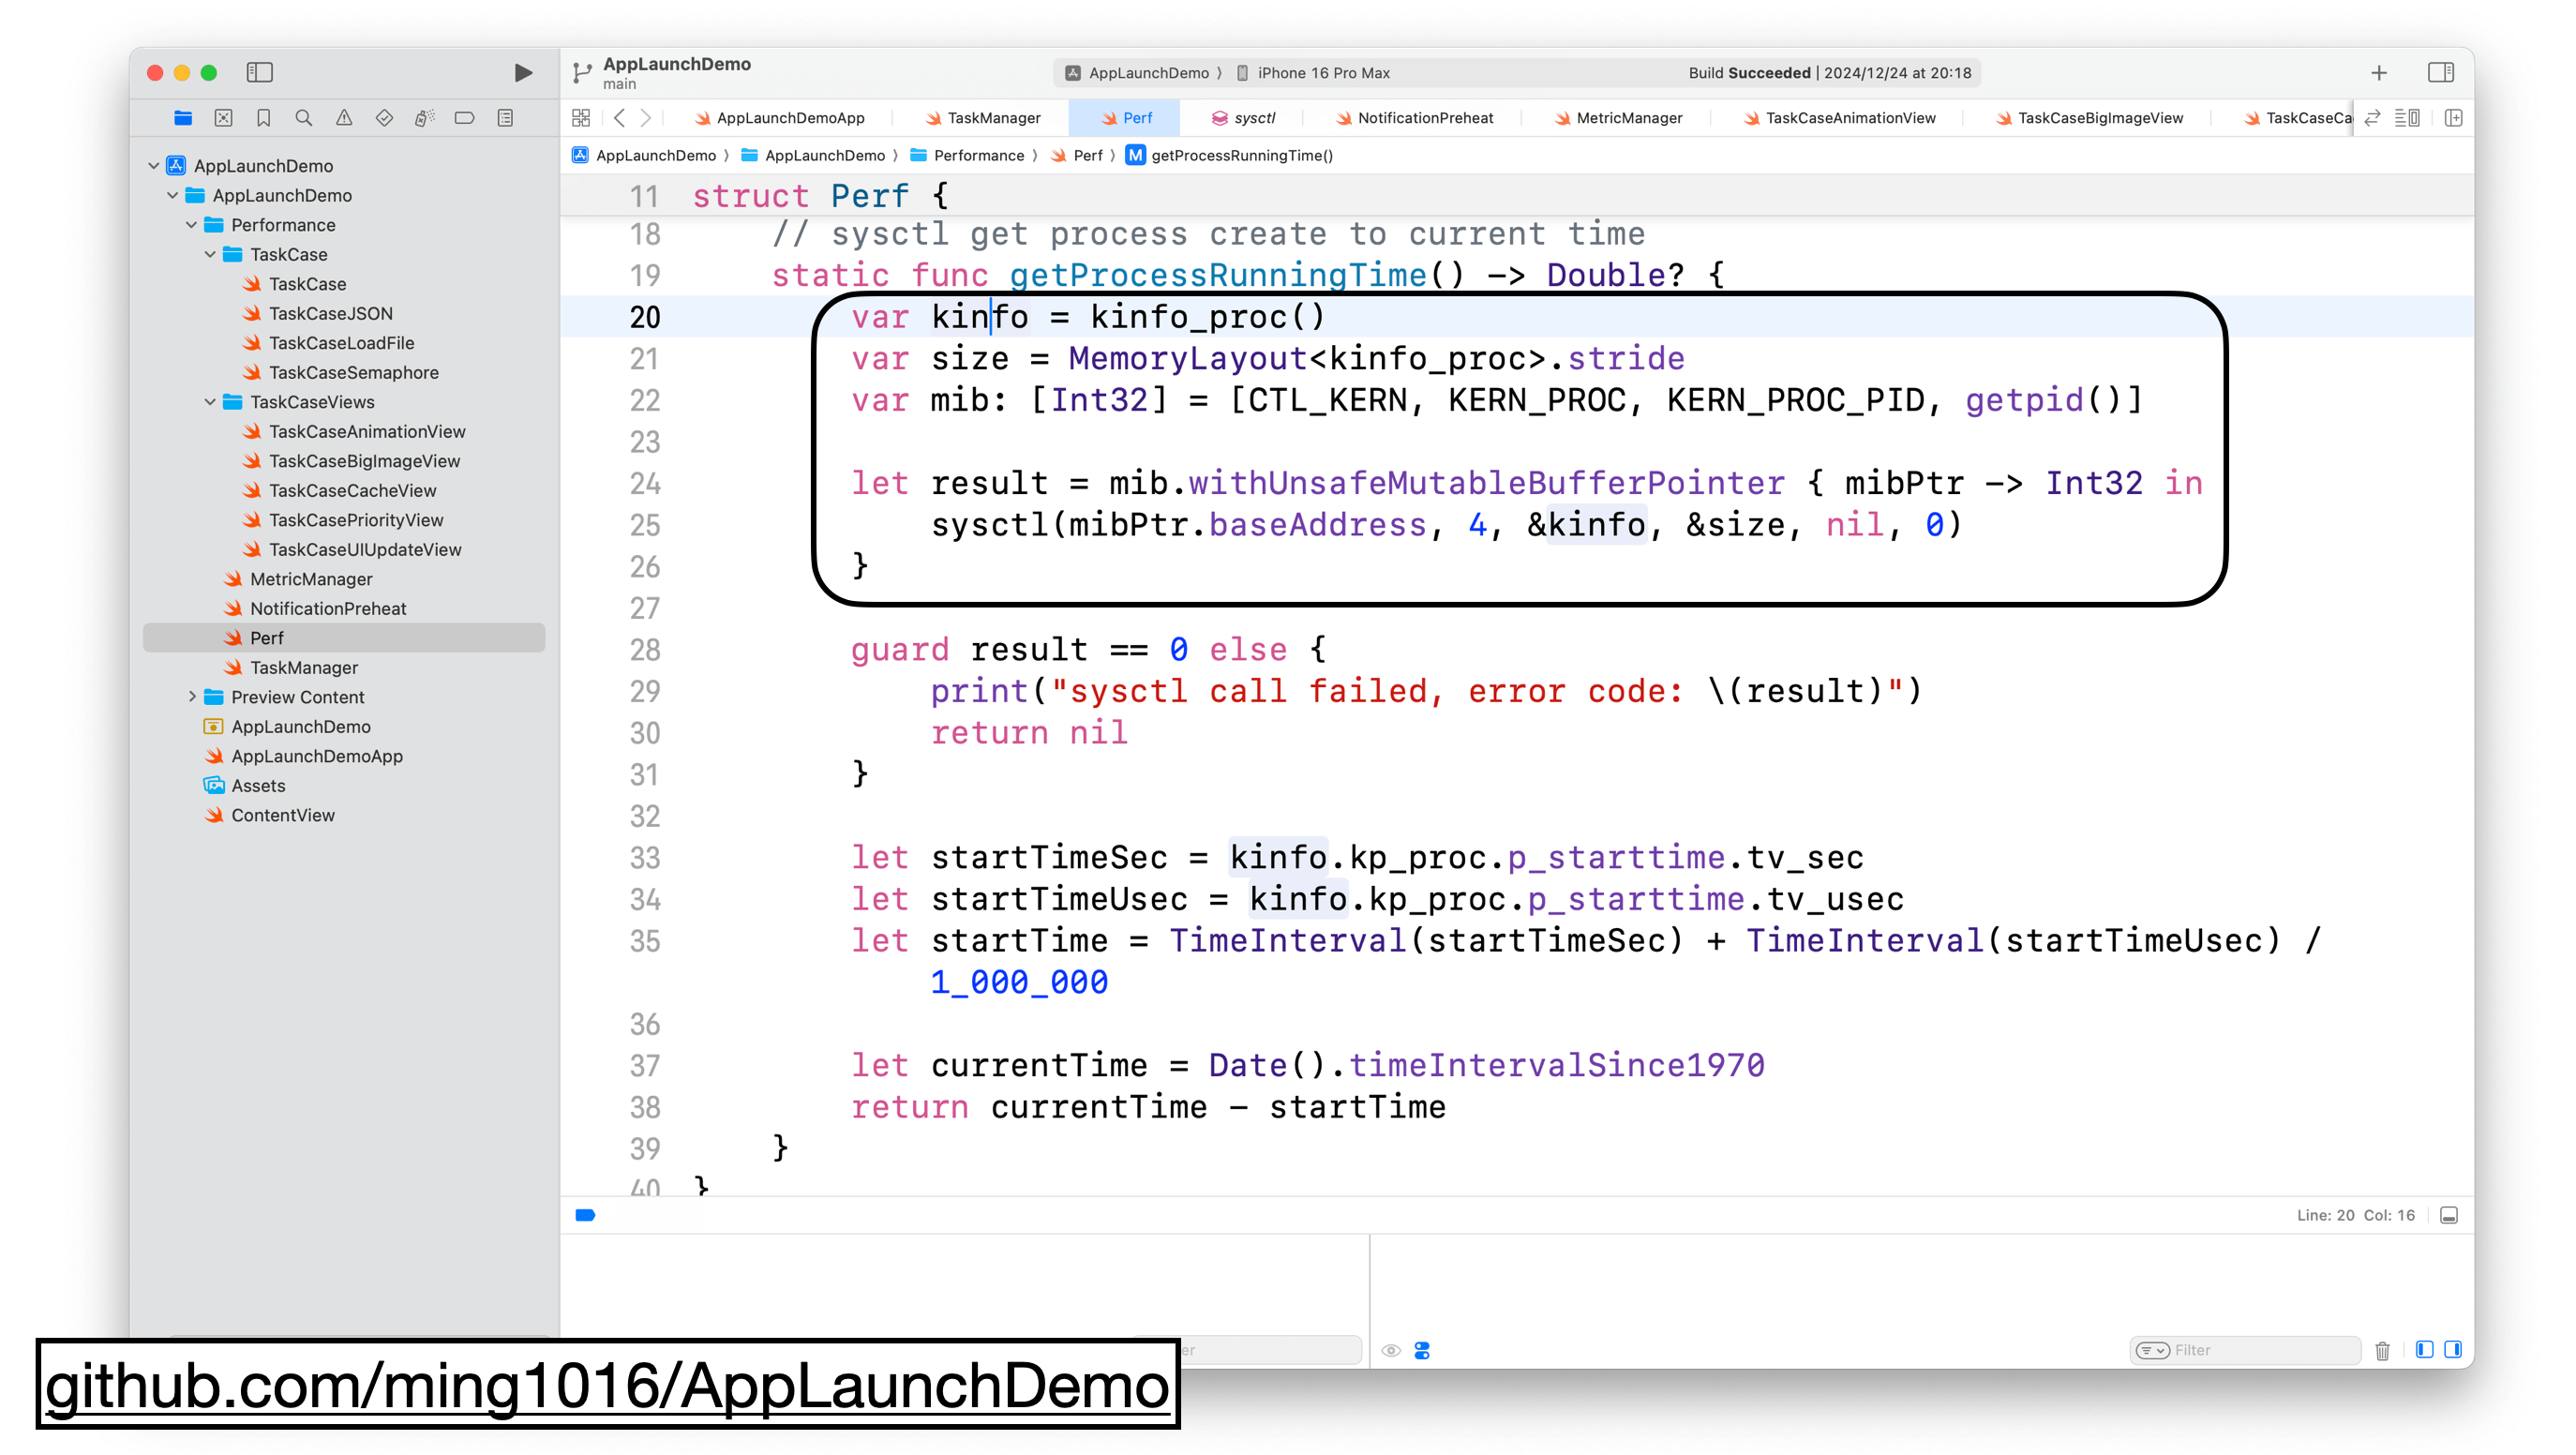
In the getProcessRunningTime function, we find the address offset for the current process’s PID in the process’s memory layout. This gives us detailed information about the current process, stored in kinfo.
We then get the current time when the function is called. By subtracting the process start time from the current time, we get the runtime since the process was created.
Now that we’ve solved the issue of not being able to track pre-main time, let’s move on to solving how to get this data without relying on Instruments.
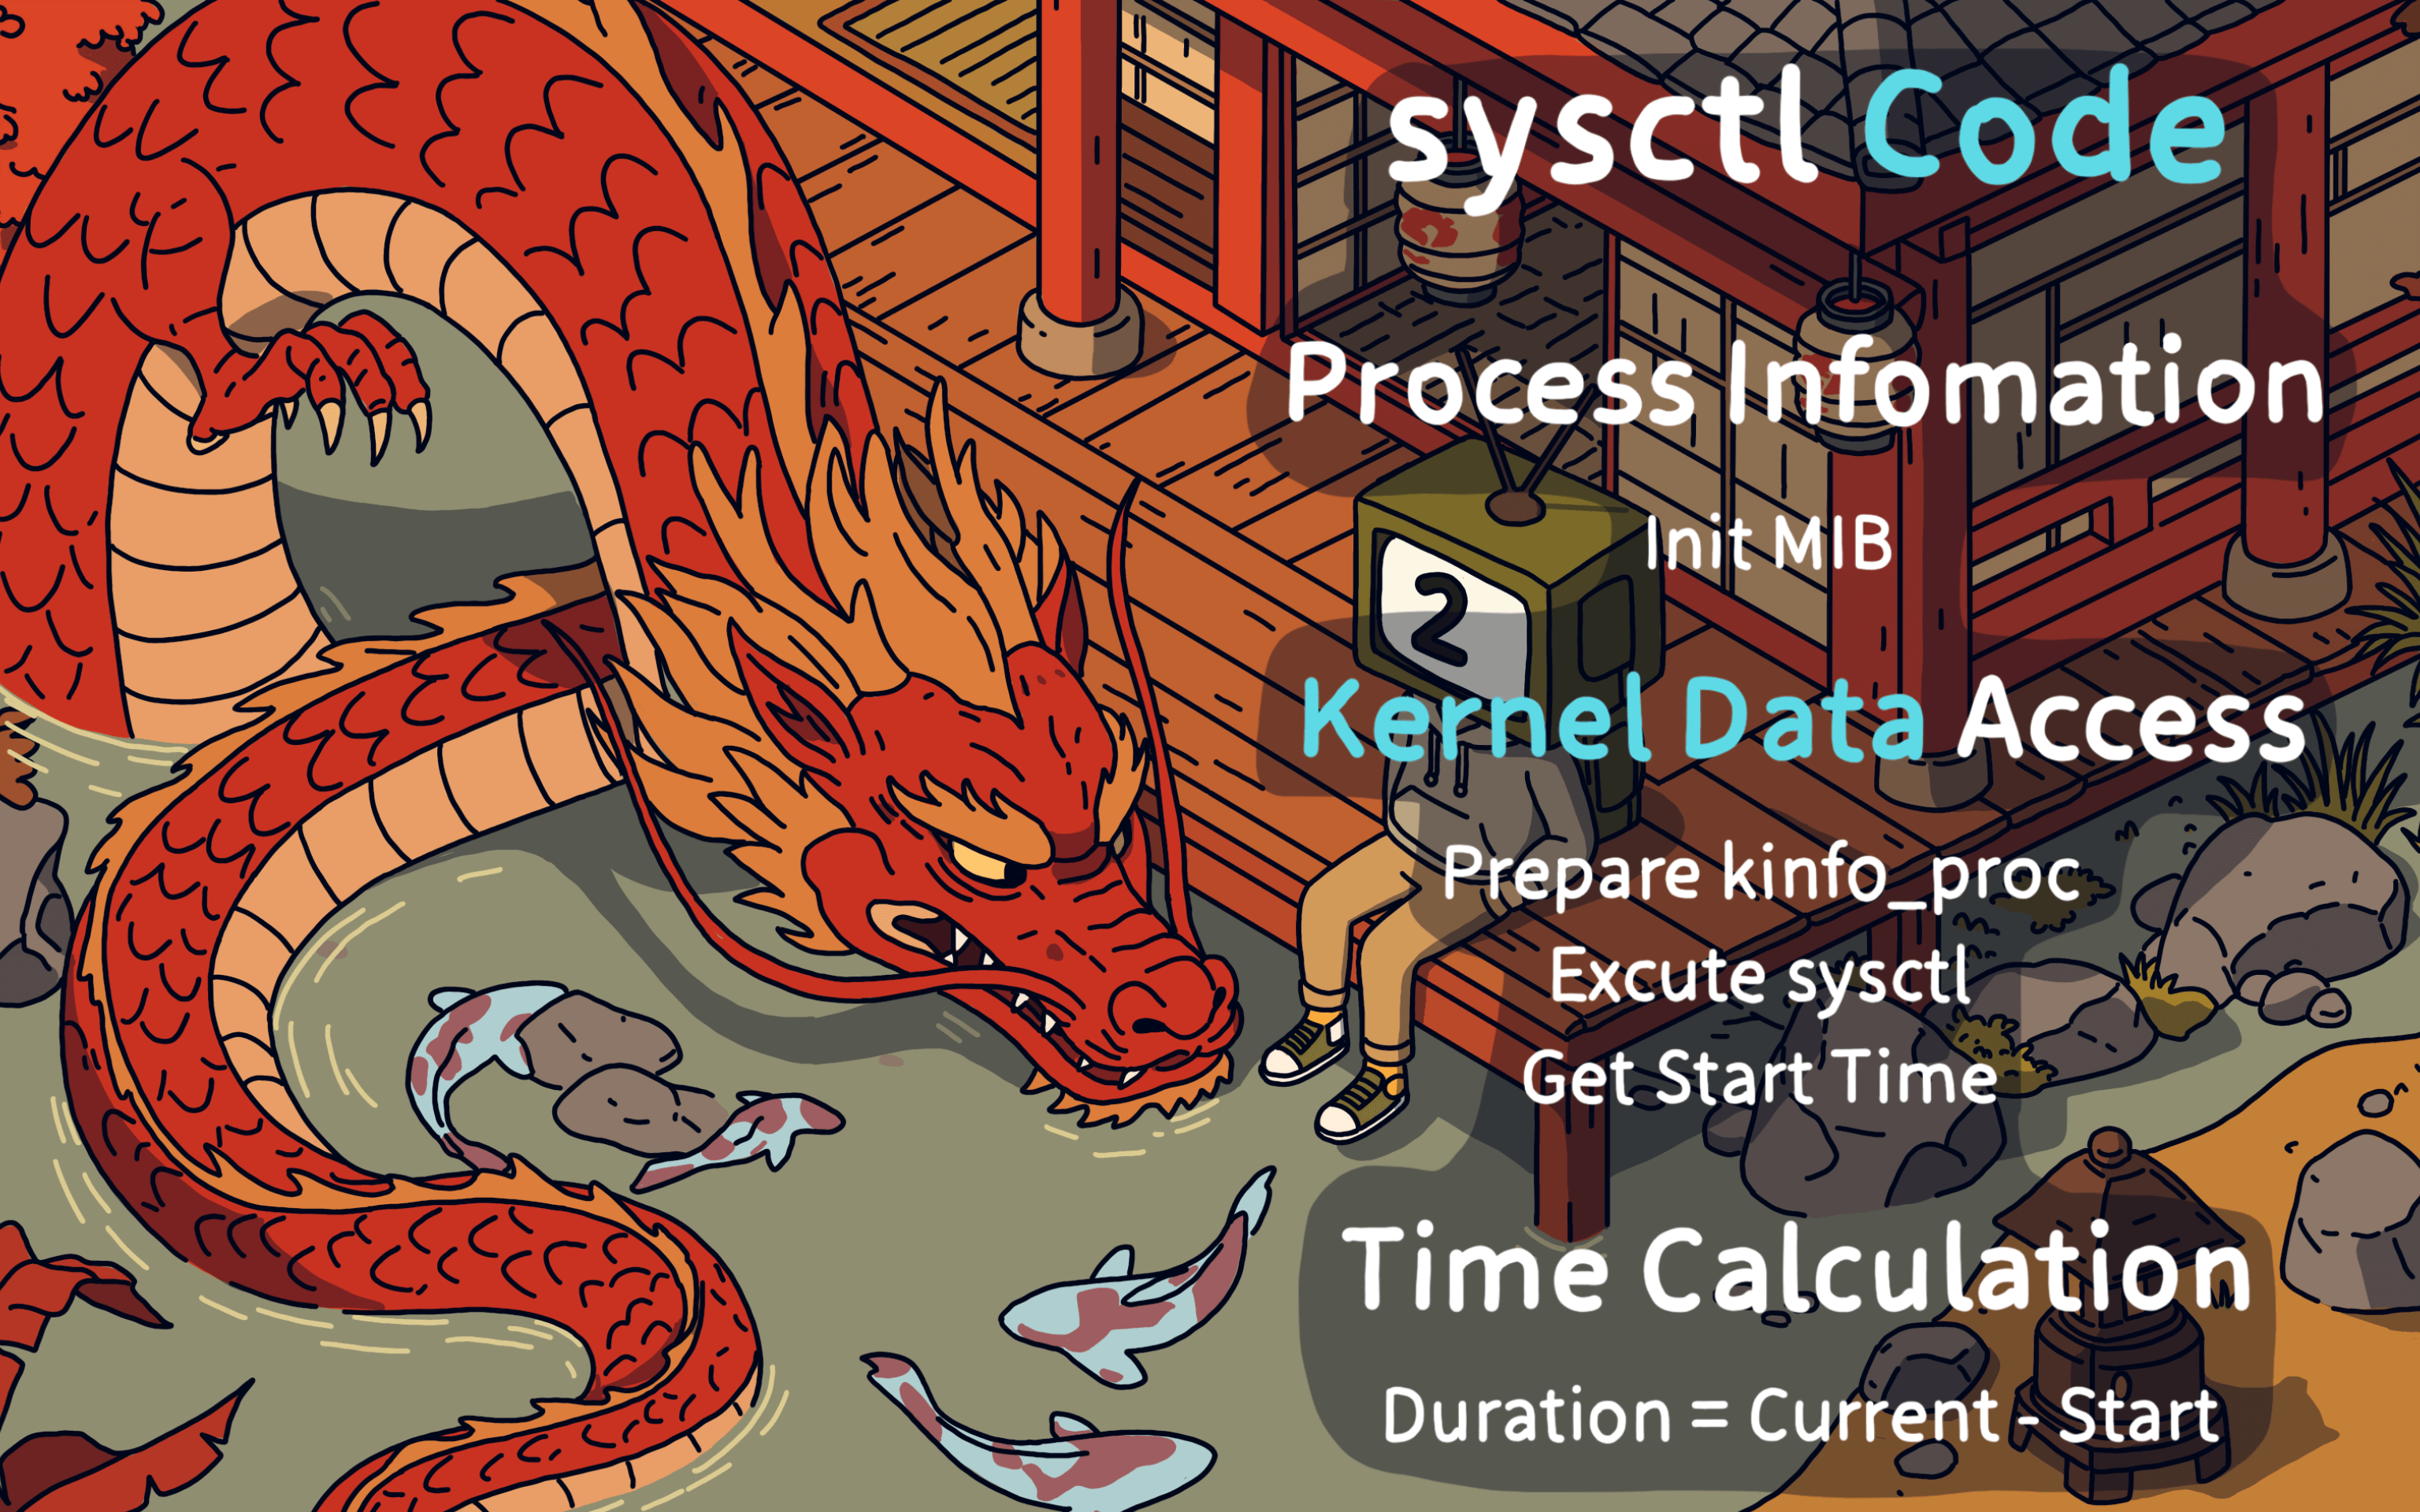
To obtain the pre-main time, you need to first gather information about the process, extract the process creation time, and then calculate the app’s running time.
Now that we’ve solved the issue of not being able to track pre-main time, let’s move on to solving how to get this data without relying on Instruments.
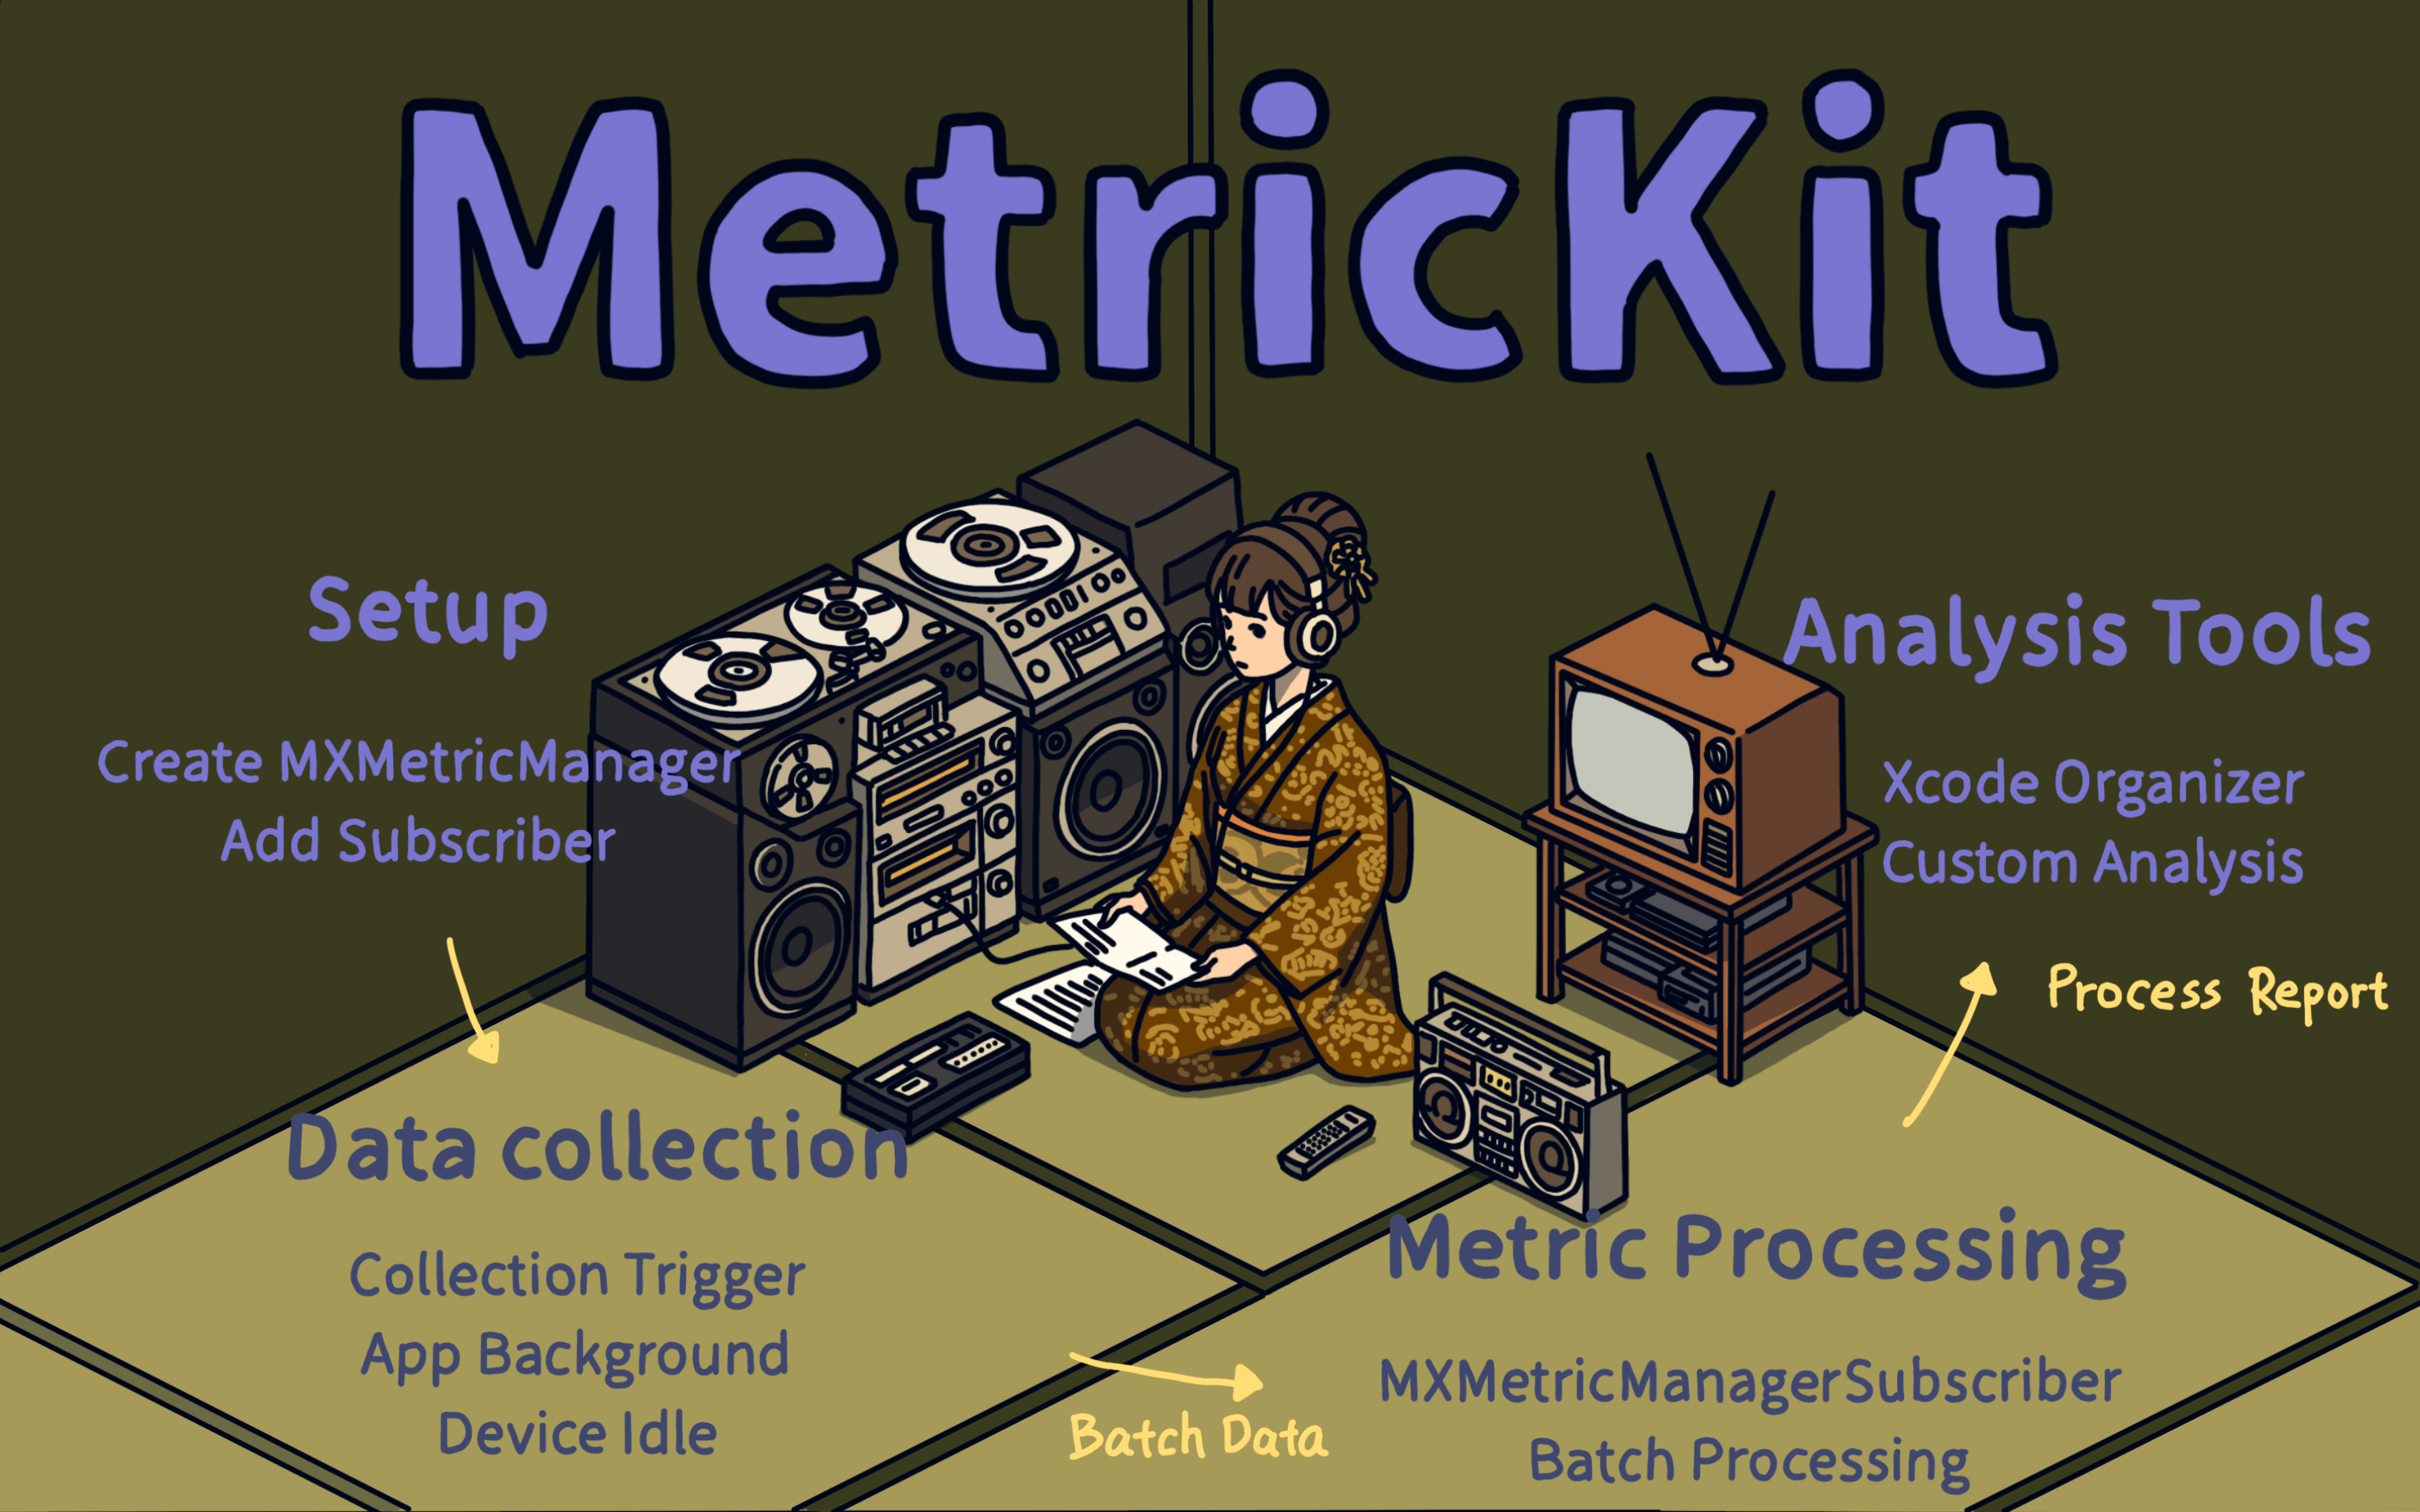
To use MetricKit, you first create an MXMetricManager and add a subscriber to collect data.
Data is collected when the app enters the background or when the device is idle.
The data processing happens in MXMetricManagerSubscriber and supports batch processing.
You can view the collected data in Xcode’s Organizer, and it also supports custom analysis.
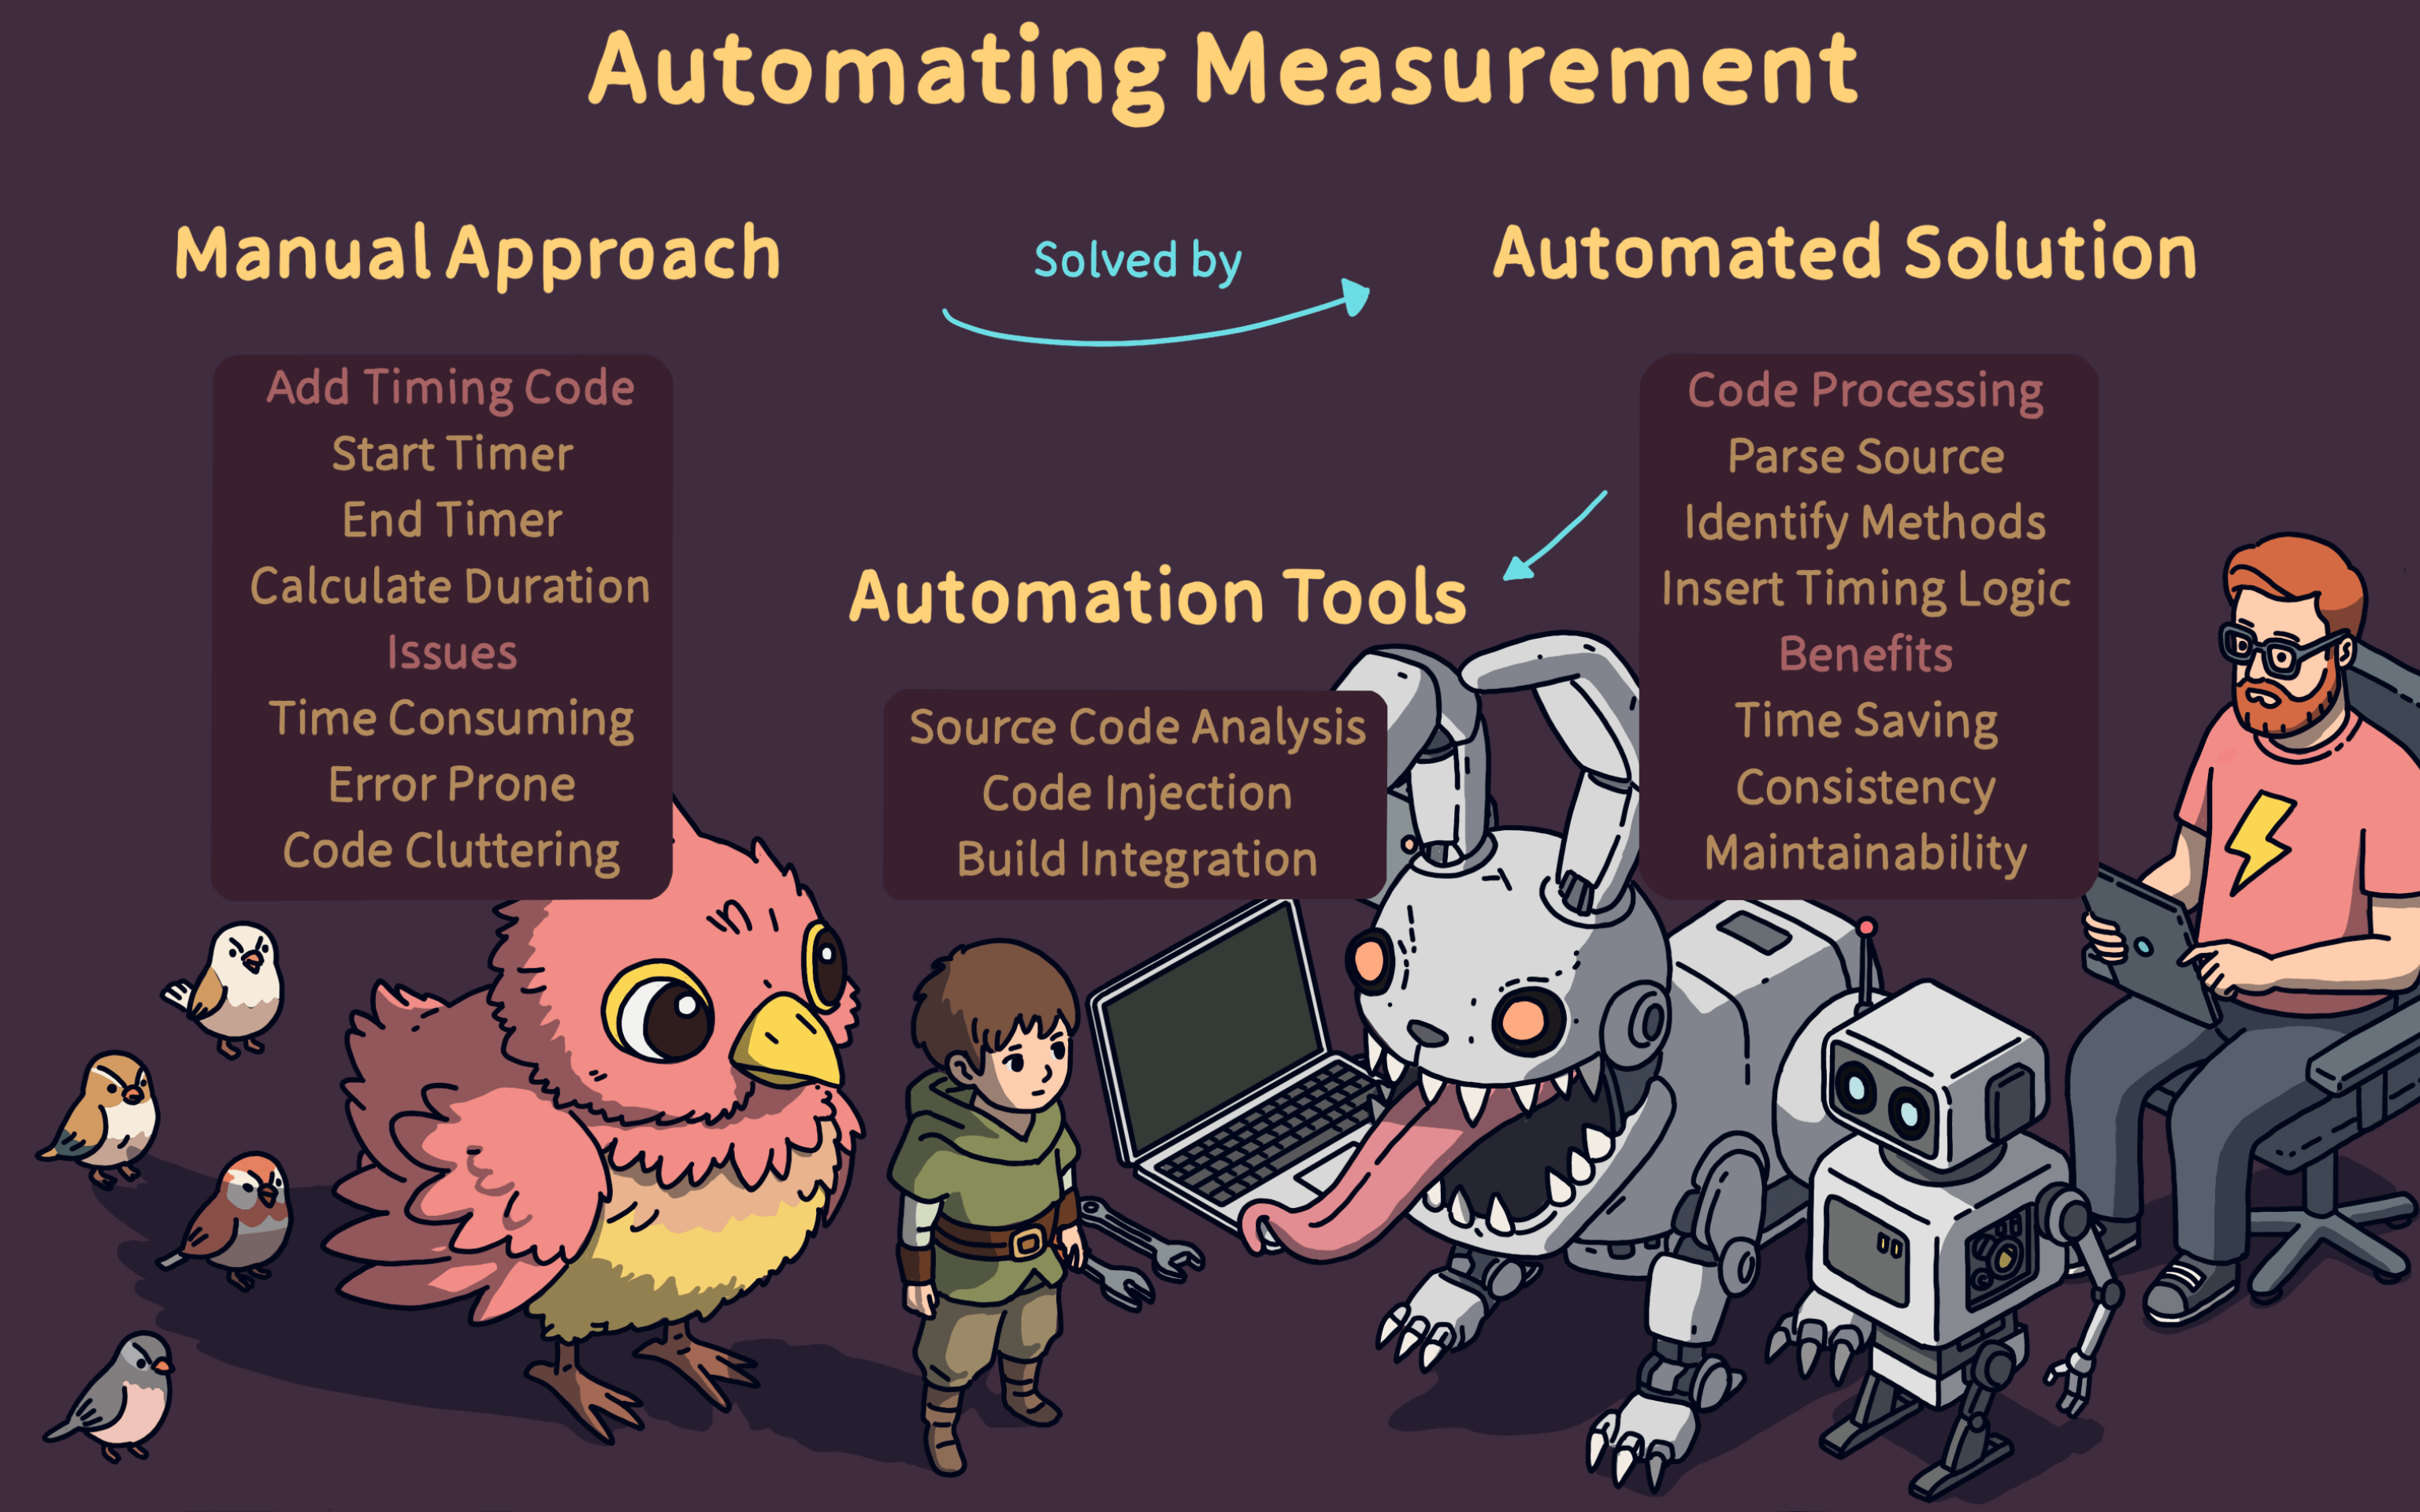
Manual analysis has many benefits, but it’s time-consuming, error-prone, and can lead to messy code. So, we need an automated solution.
The automated process involves using tools to parse the code, find method definitions, and insert timing logic. This saves development time and makes the code easier to maintain.
Tools available for this include source code analysis tools and build integration tools.
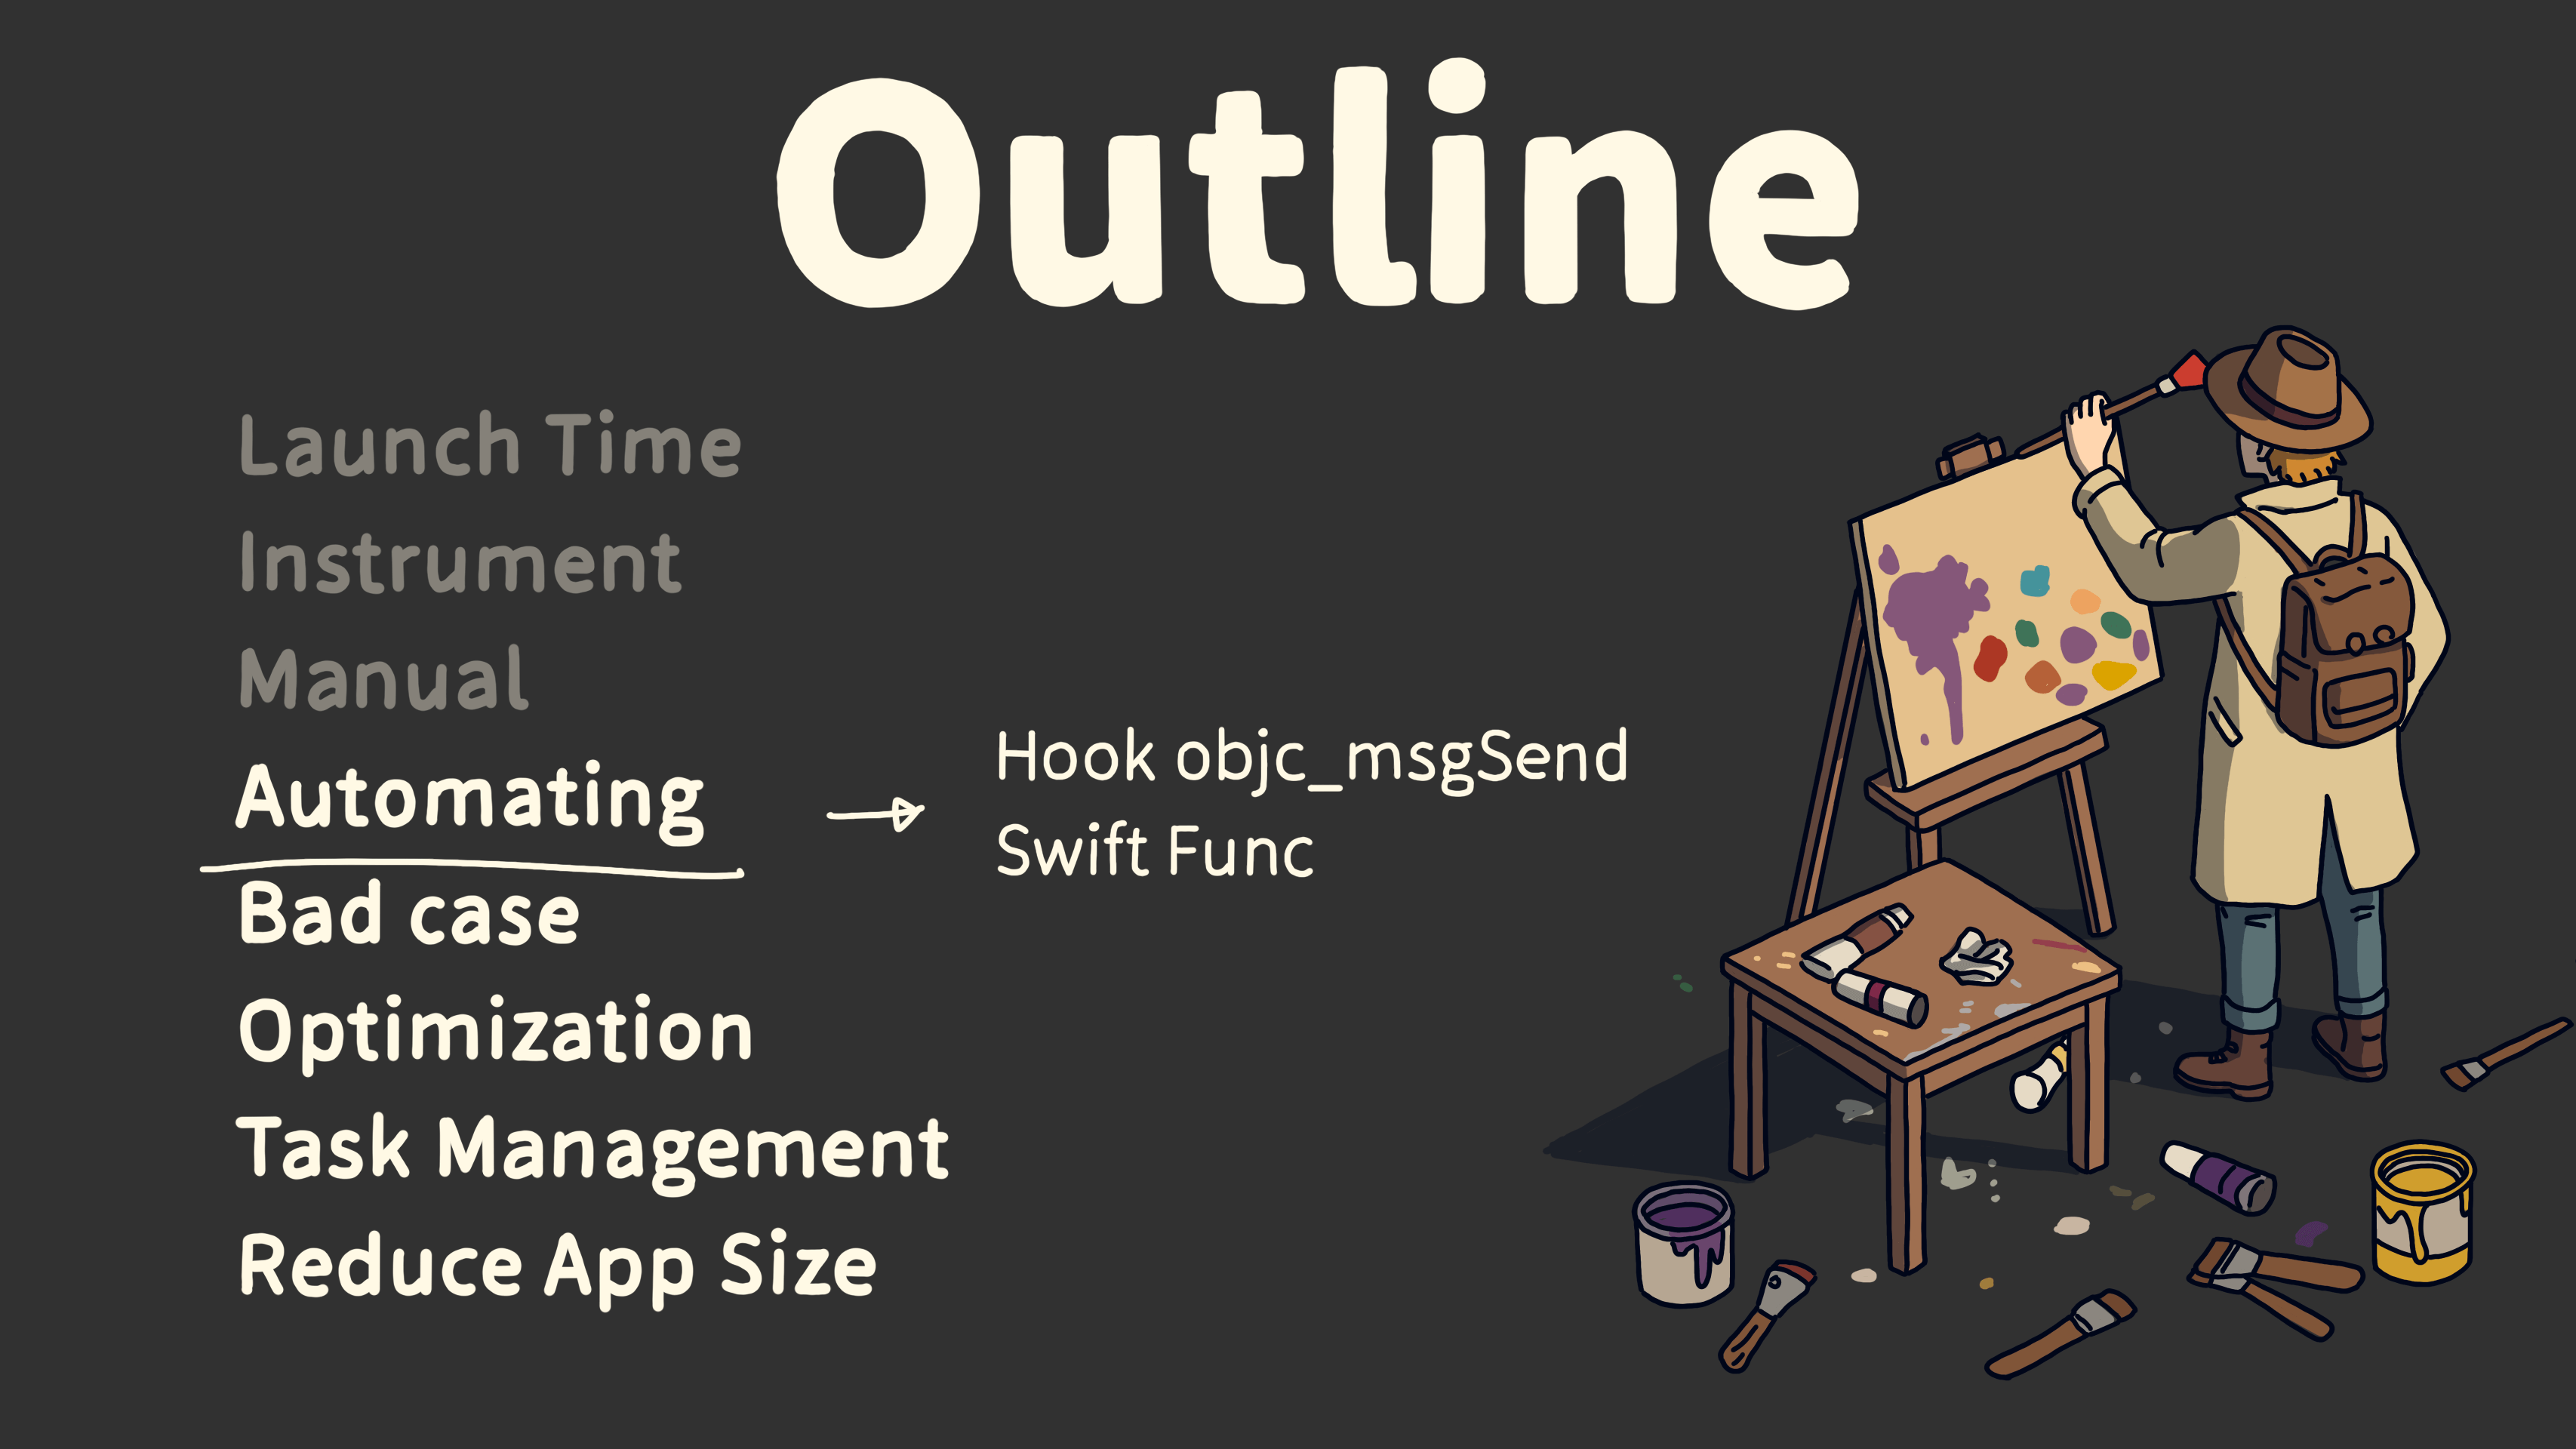
Next, I’ll cover some automated ways to measure time, including how to hook objc_msgSend to track the time of Objective-C function calls.
For Swift projects, I’ll also explain how to track the time of each Swift function.
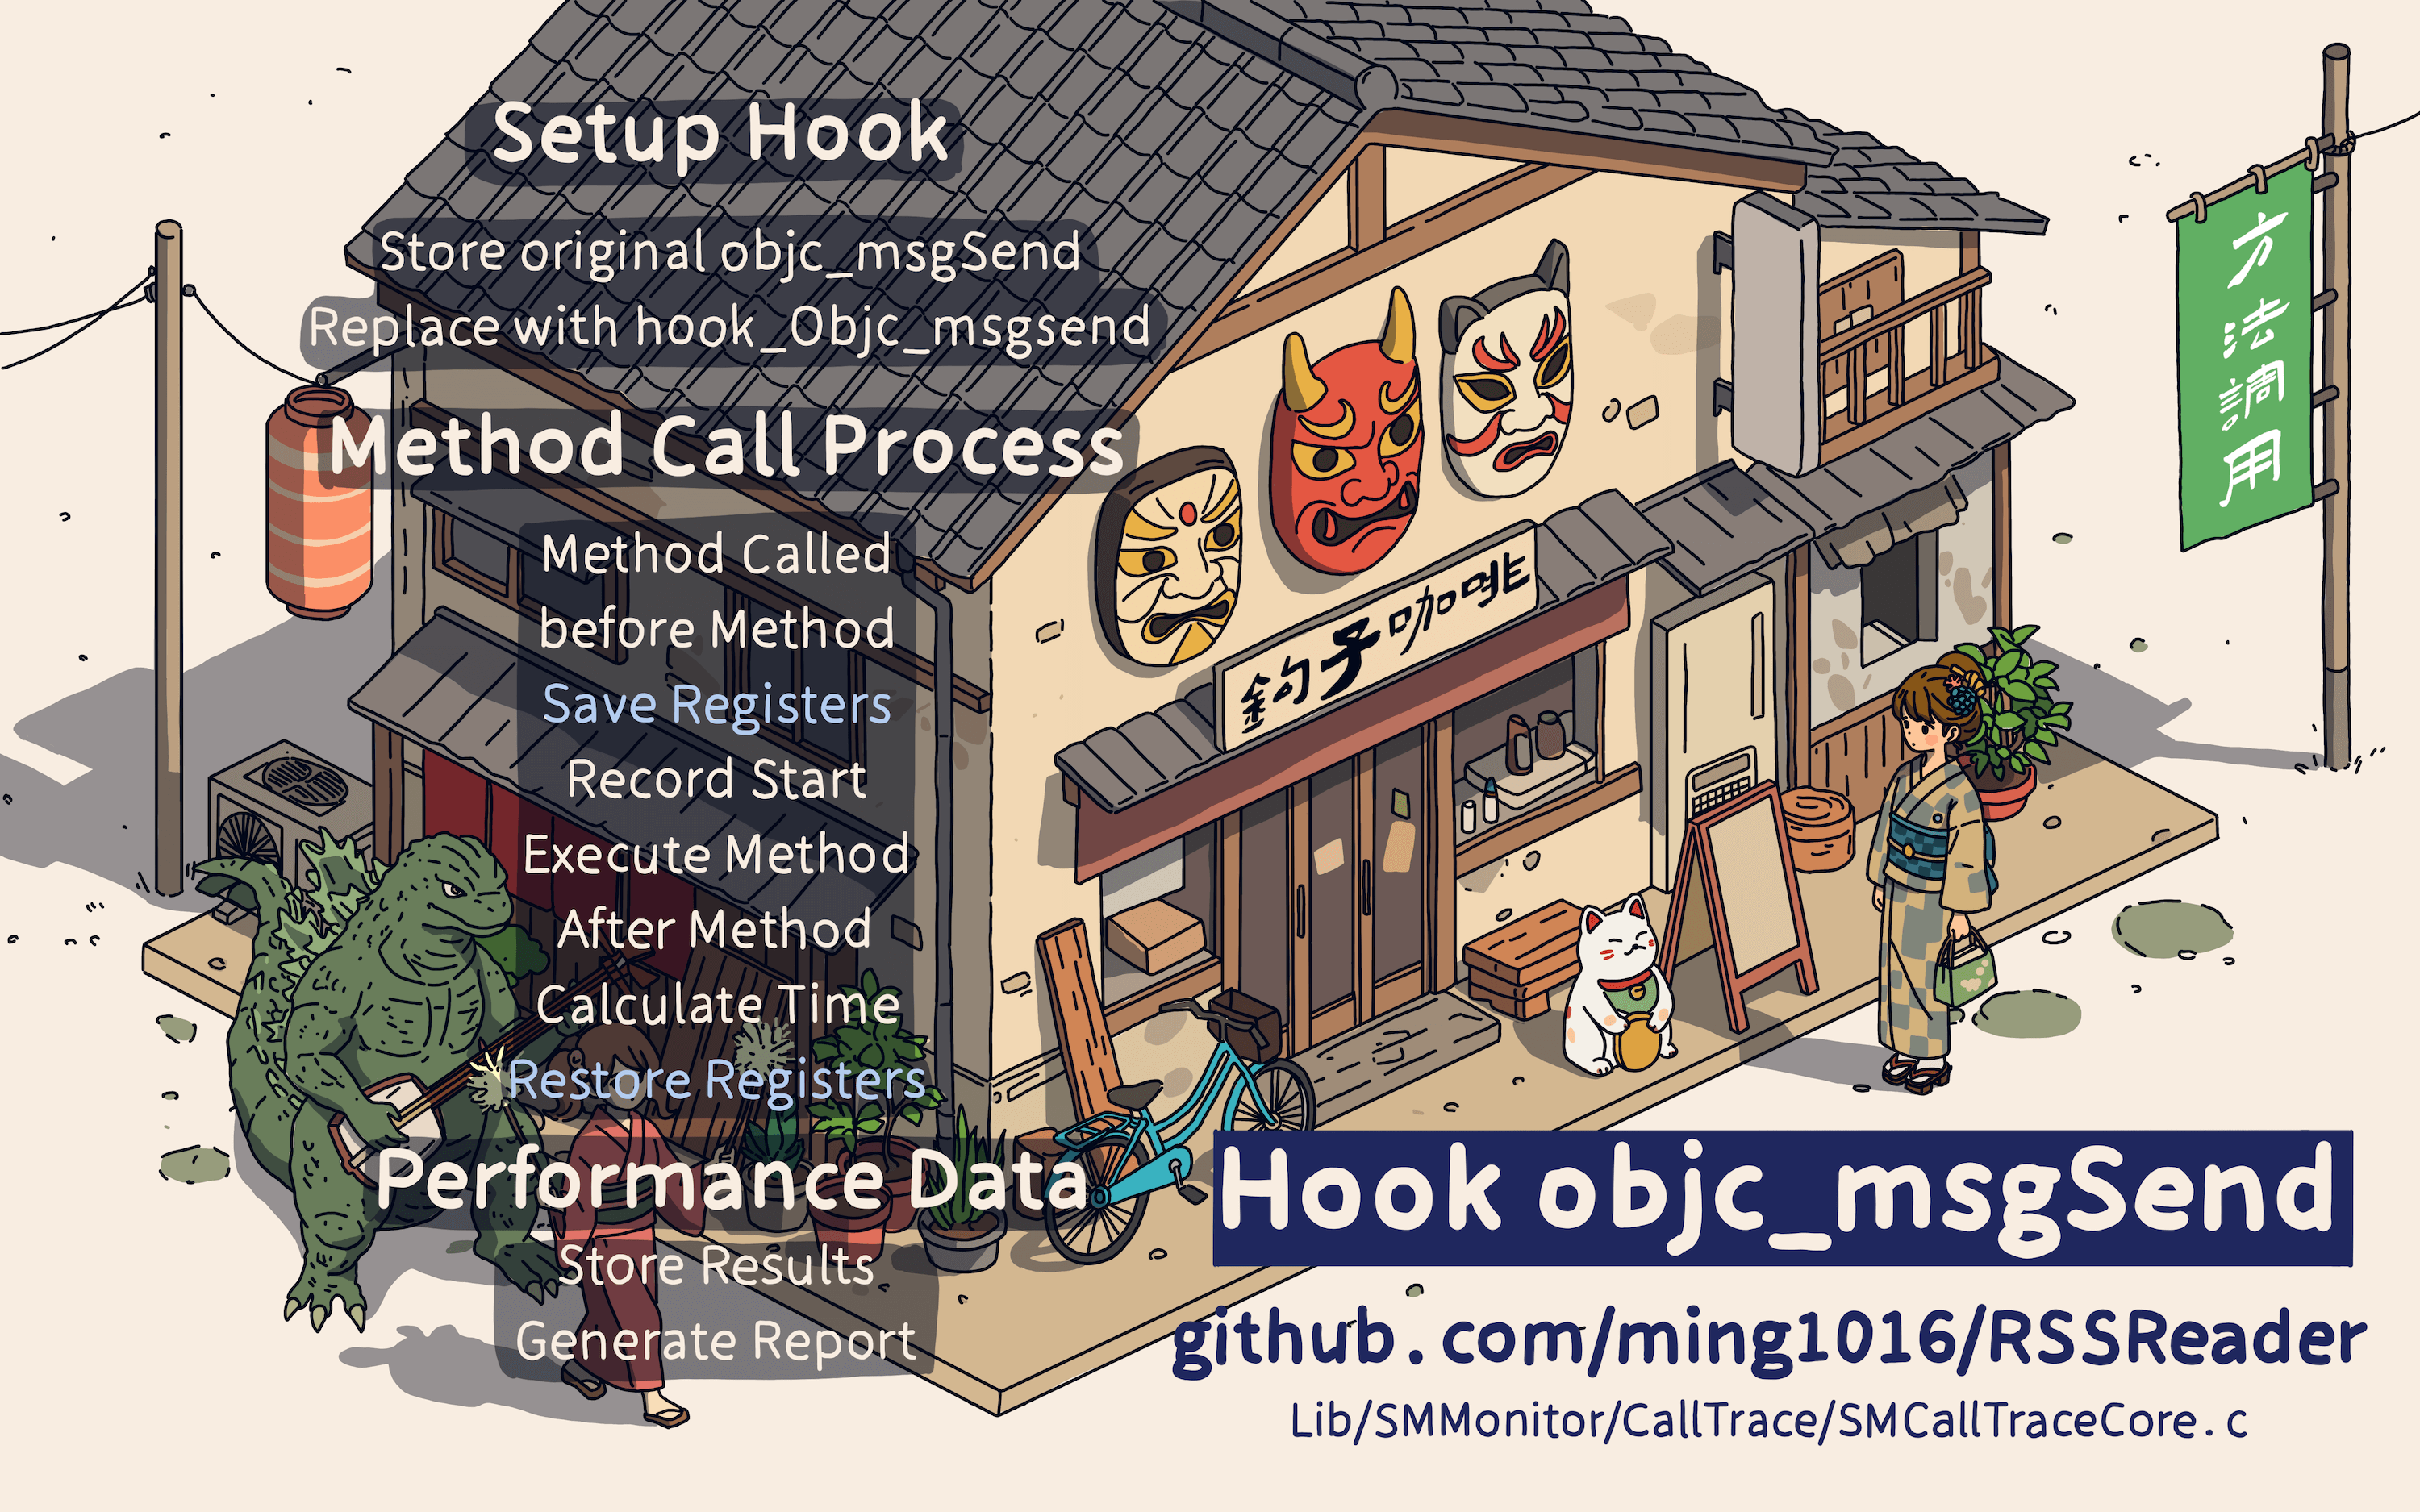
Let’s first see how to track the time of Objective-C functions. Since all Objective-C functions are called through objc_msgSend, we can hook this method to track the time of all Objective-C functions.
The approach is to use fishhook to replace the objc_msgSend C function.
Since objc_msgSend is written in assembly, we also need to use assembly to do the method replacement.
In the replacement, we save the necessary registers before the method call and restore them afterward.
We track the time before and after the method call, save the time for each function, and generate a report.
You can view the full code at the link below.
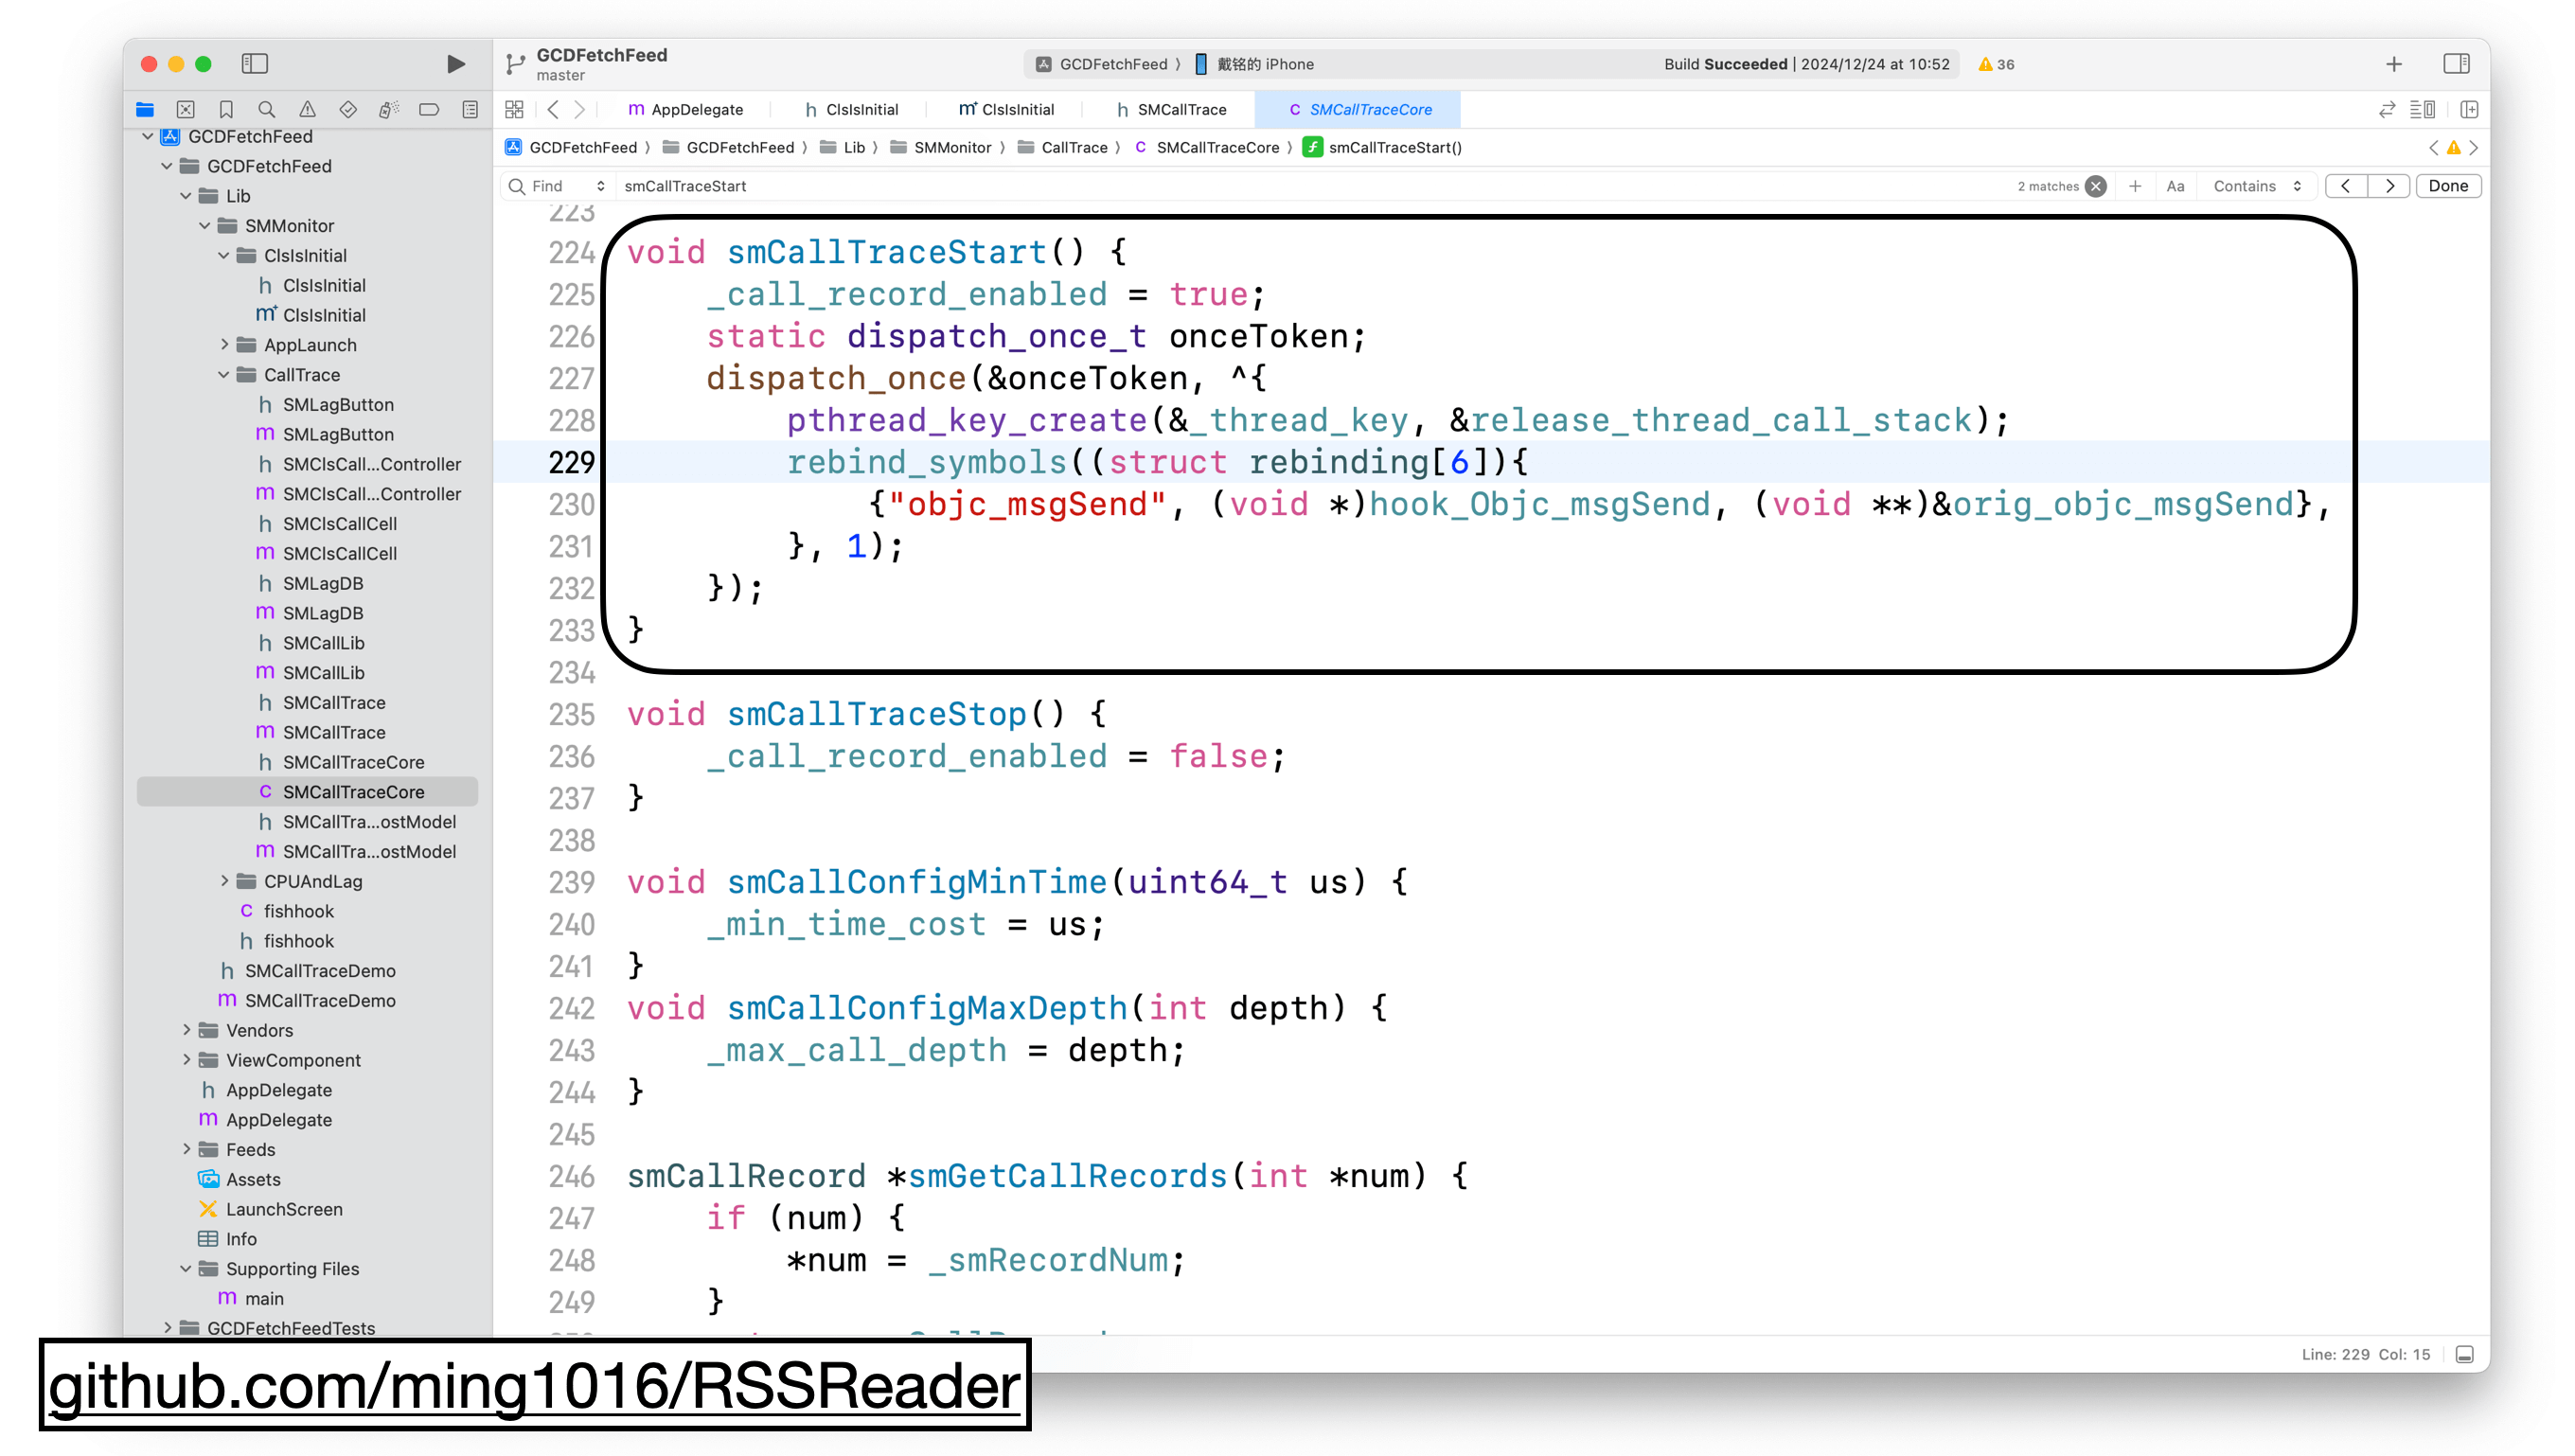
Here is the code. In the smCallTraceStart function, we use fishhook‘s rebind_symbols to replace the method. The original objc_msgSend is saved as orig_objc_msgSend, and the hook logic is in hook_Objc_msgSend.
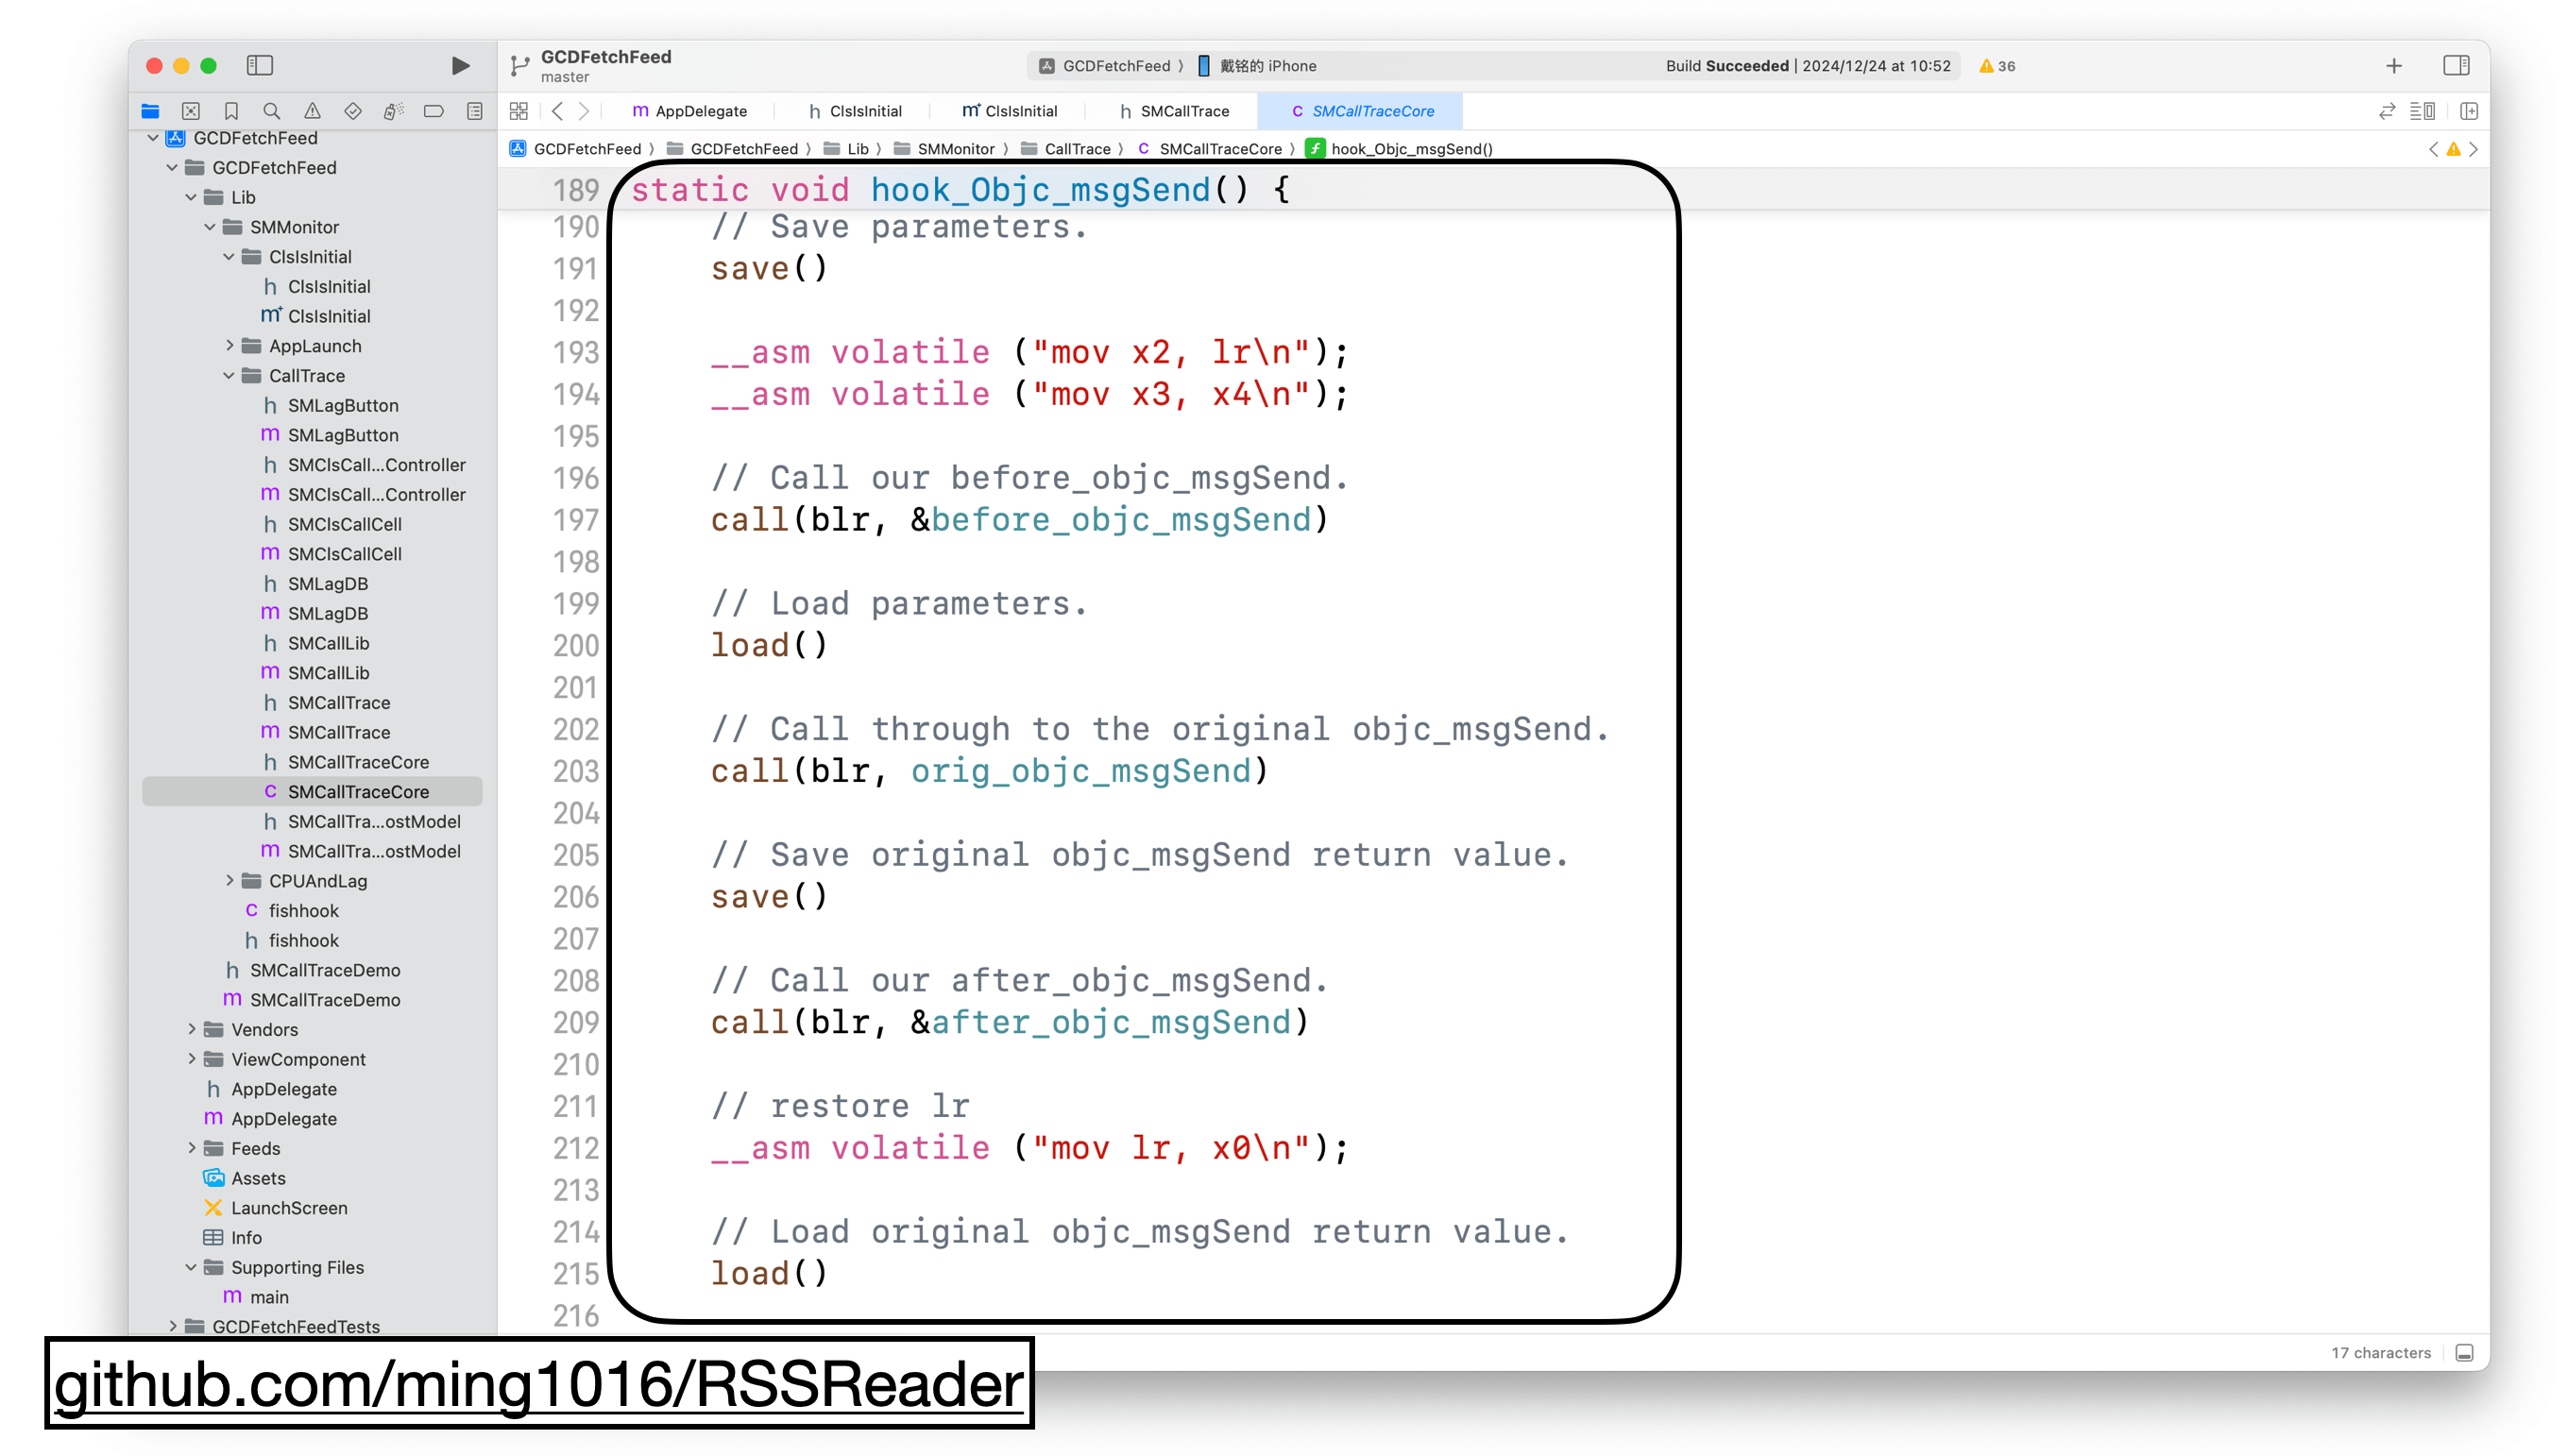
In the hook_Objc_msgSend method, we first save the method call parameters, then record the start time with before_objc_msgSend. After reading the parameters, we call the original objc_msgSend, save its return value, and calculate the function execution time.
Finally, we return the value from objc_msgSend and wrap everything in an interface for easy use.
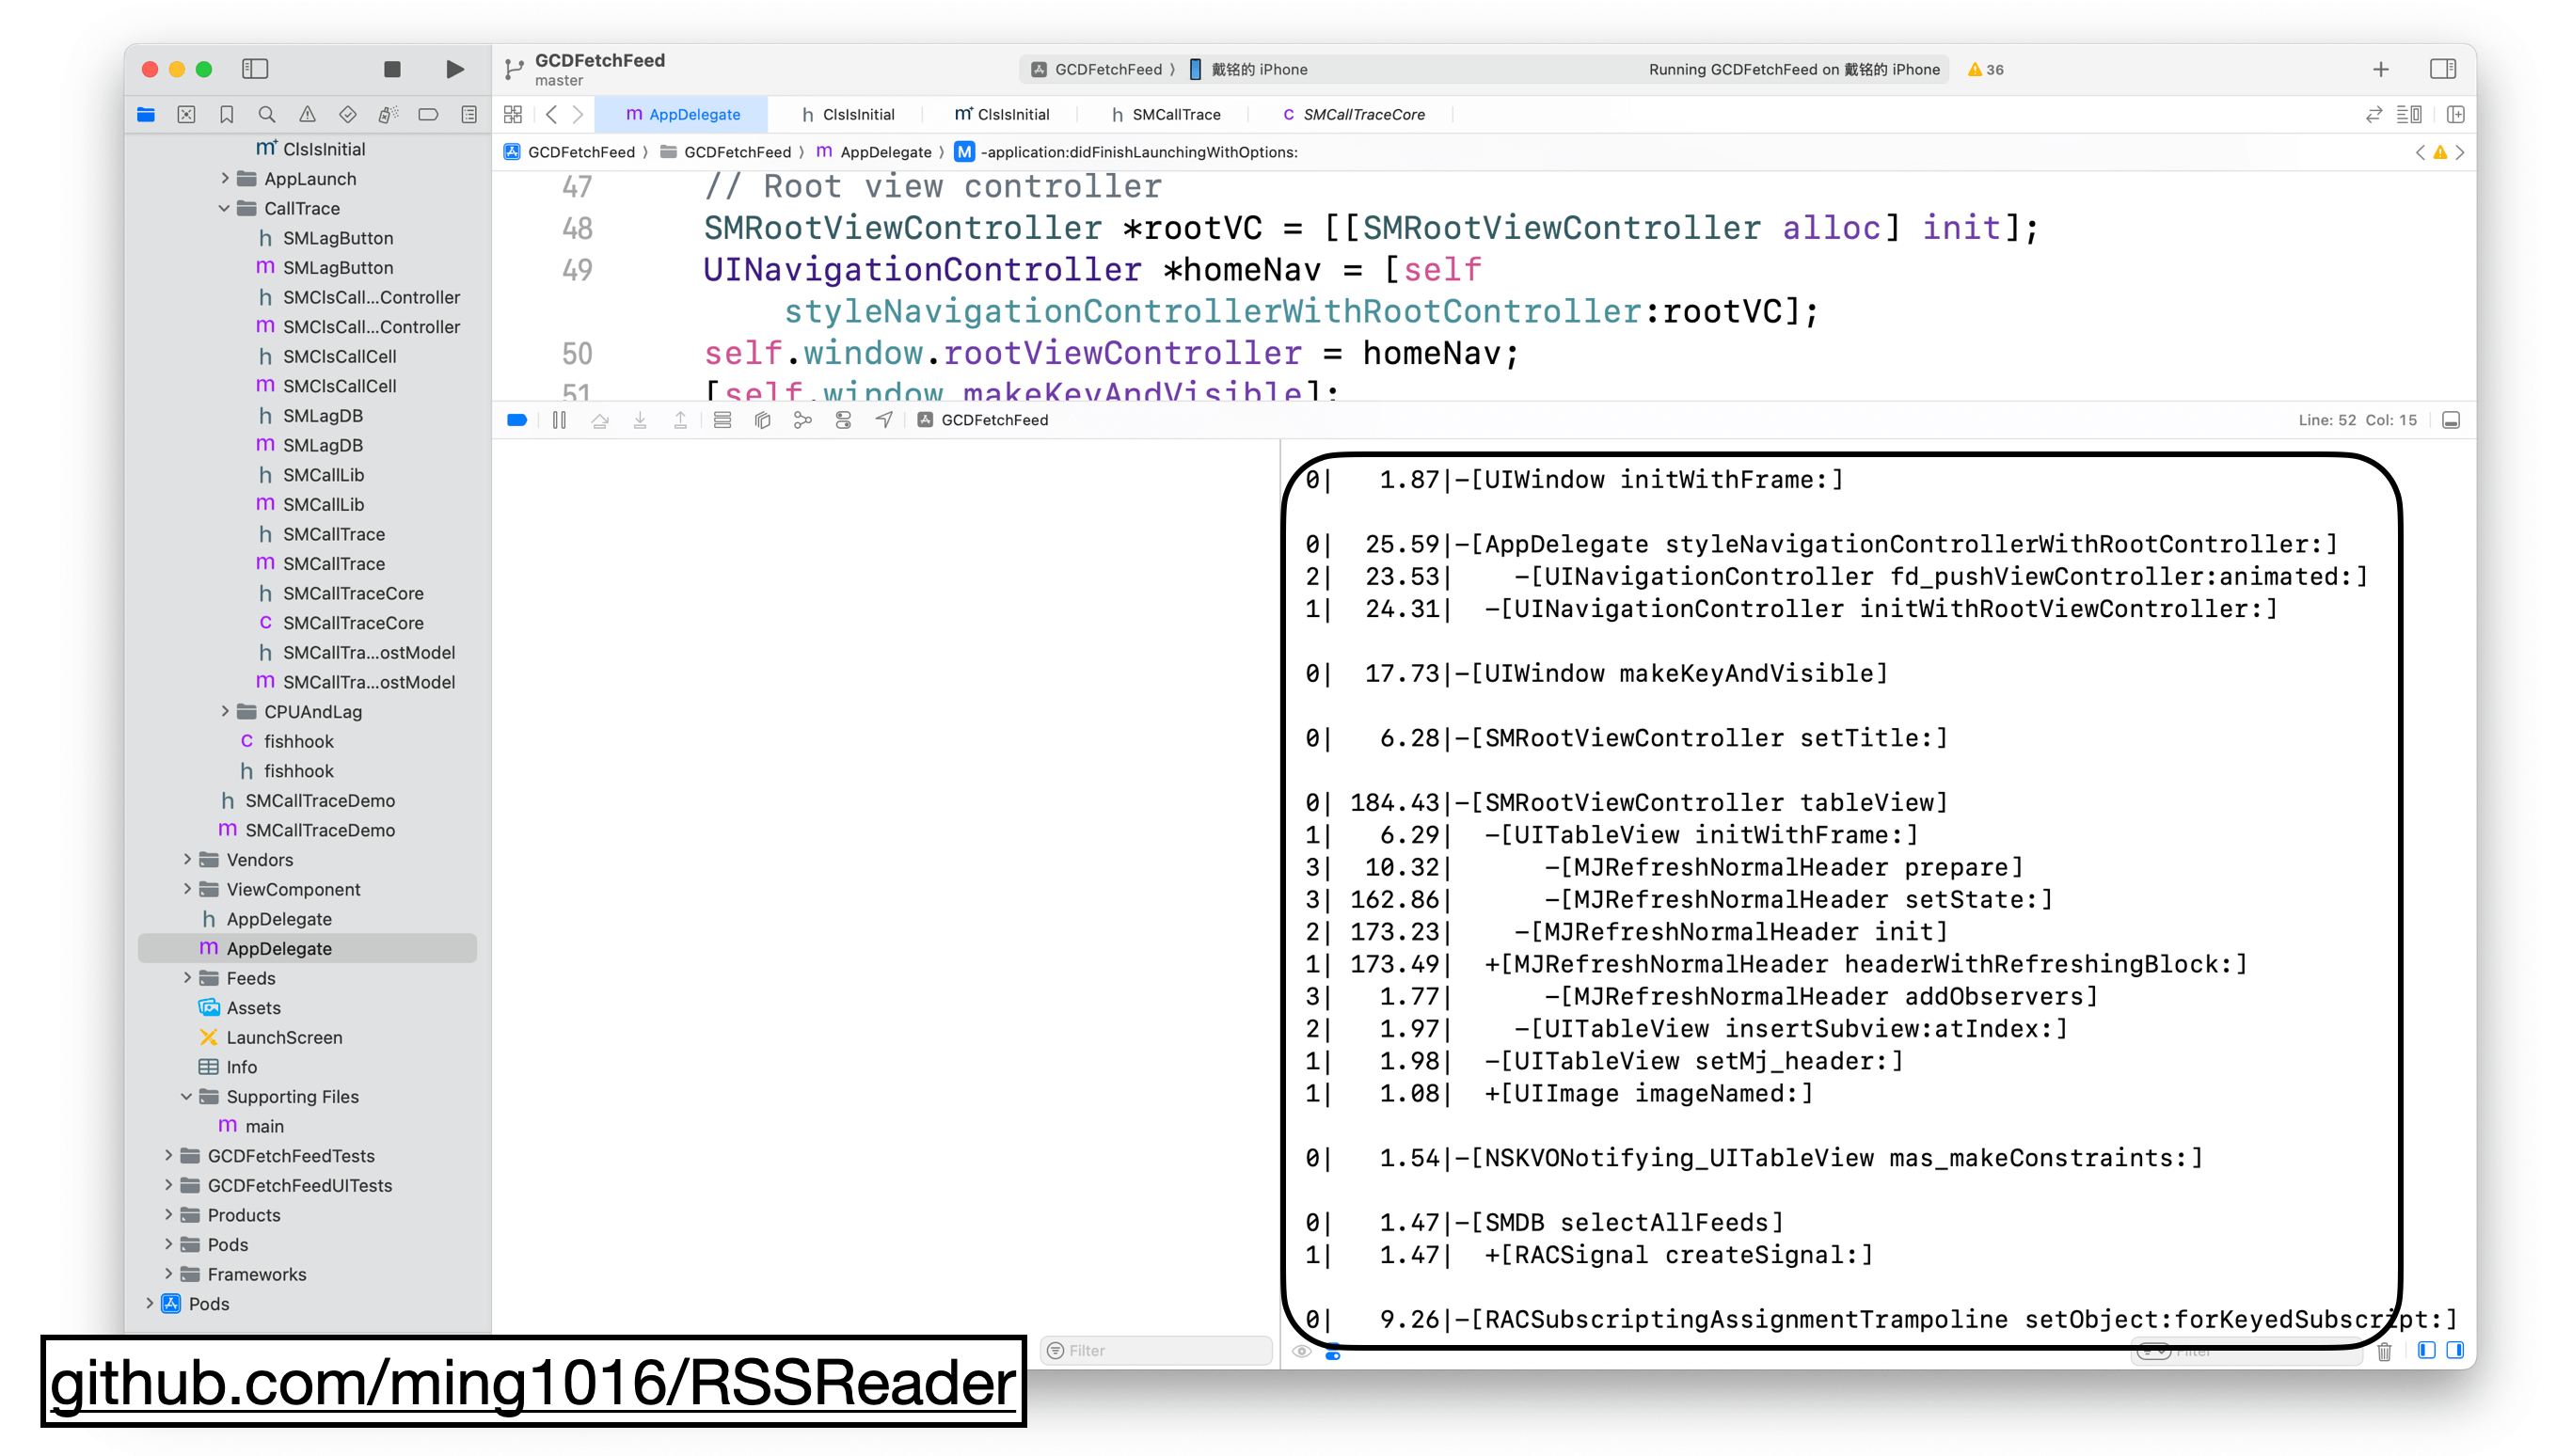
After running it, you’ll see that the execution time of all functions is recorded.
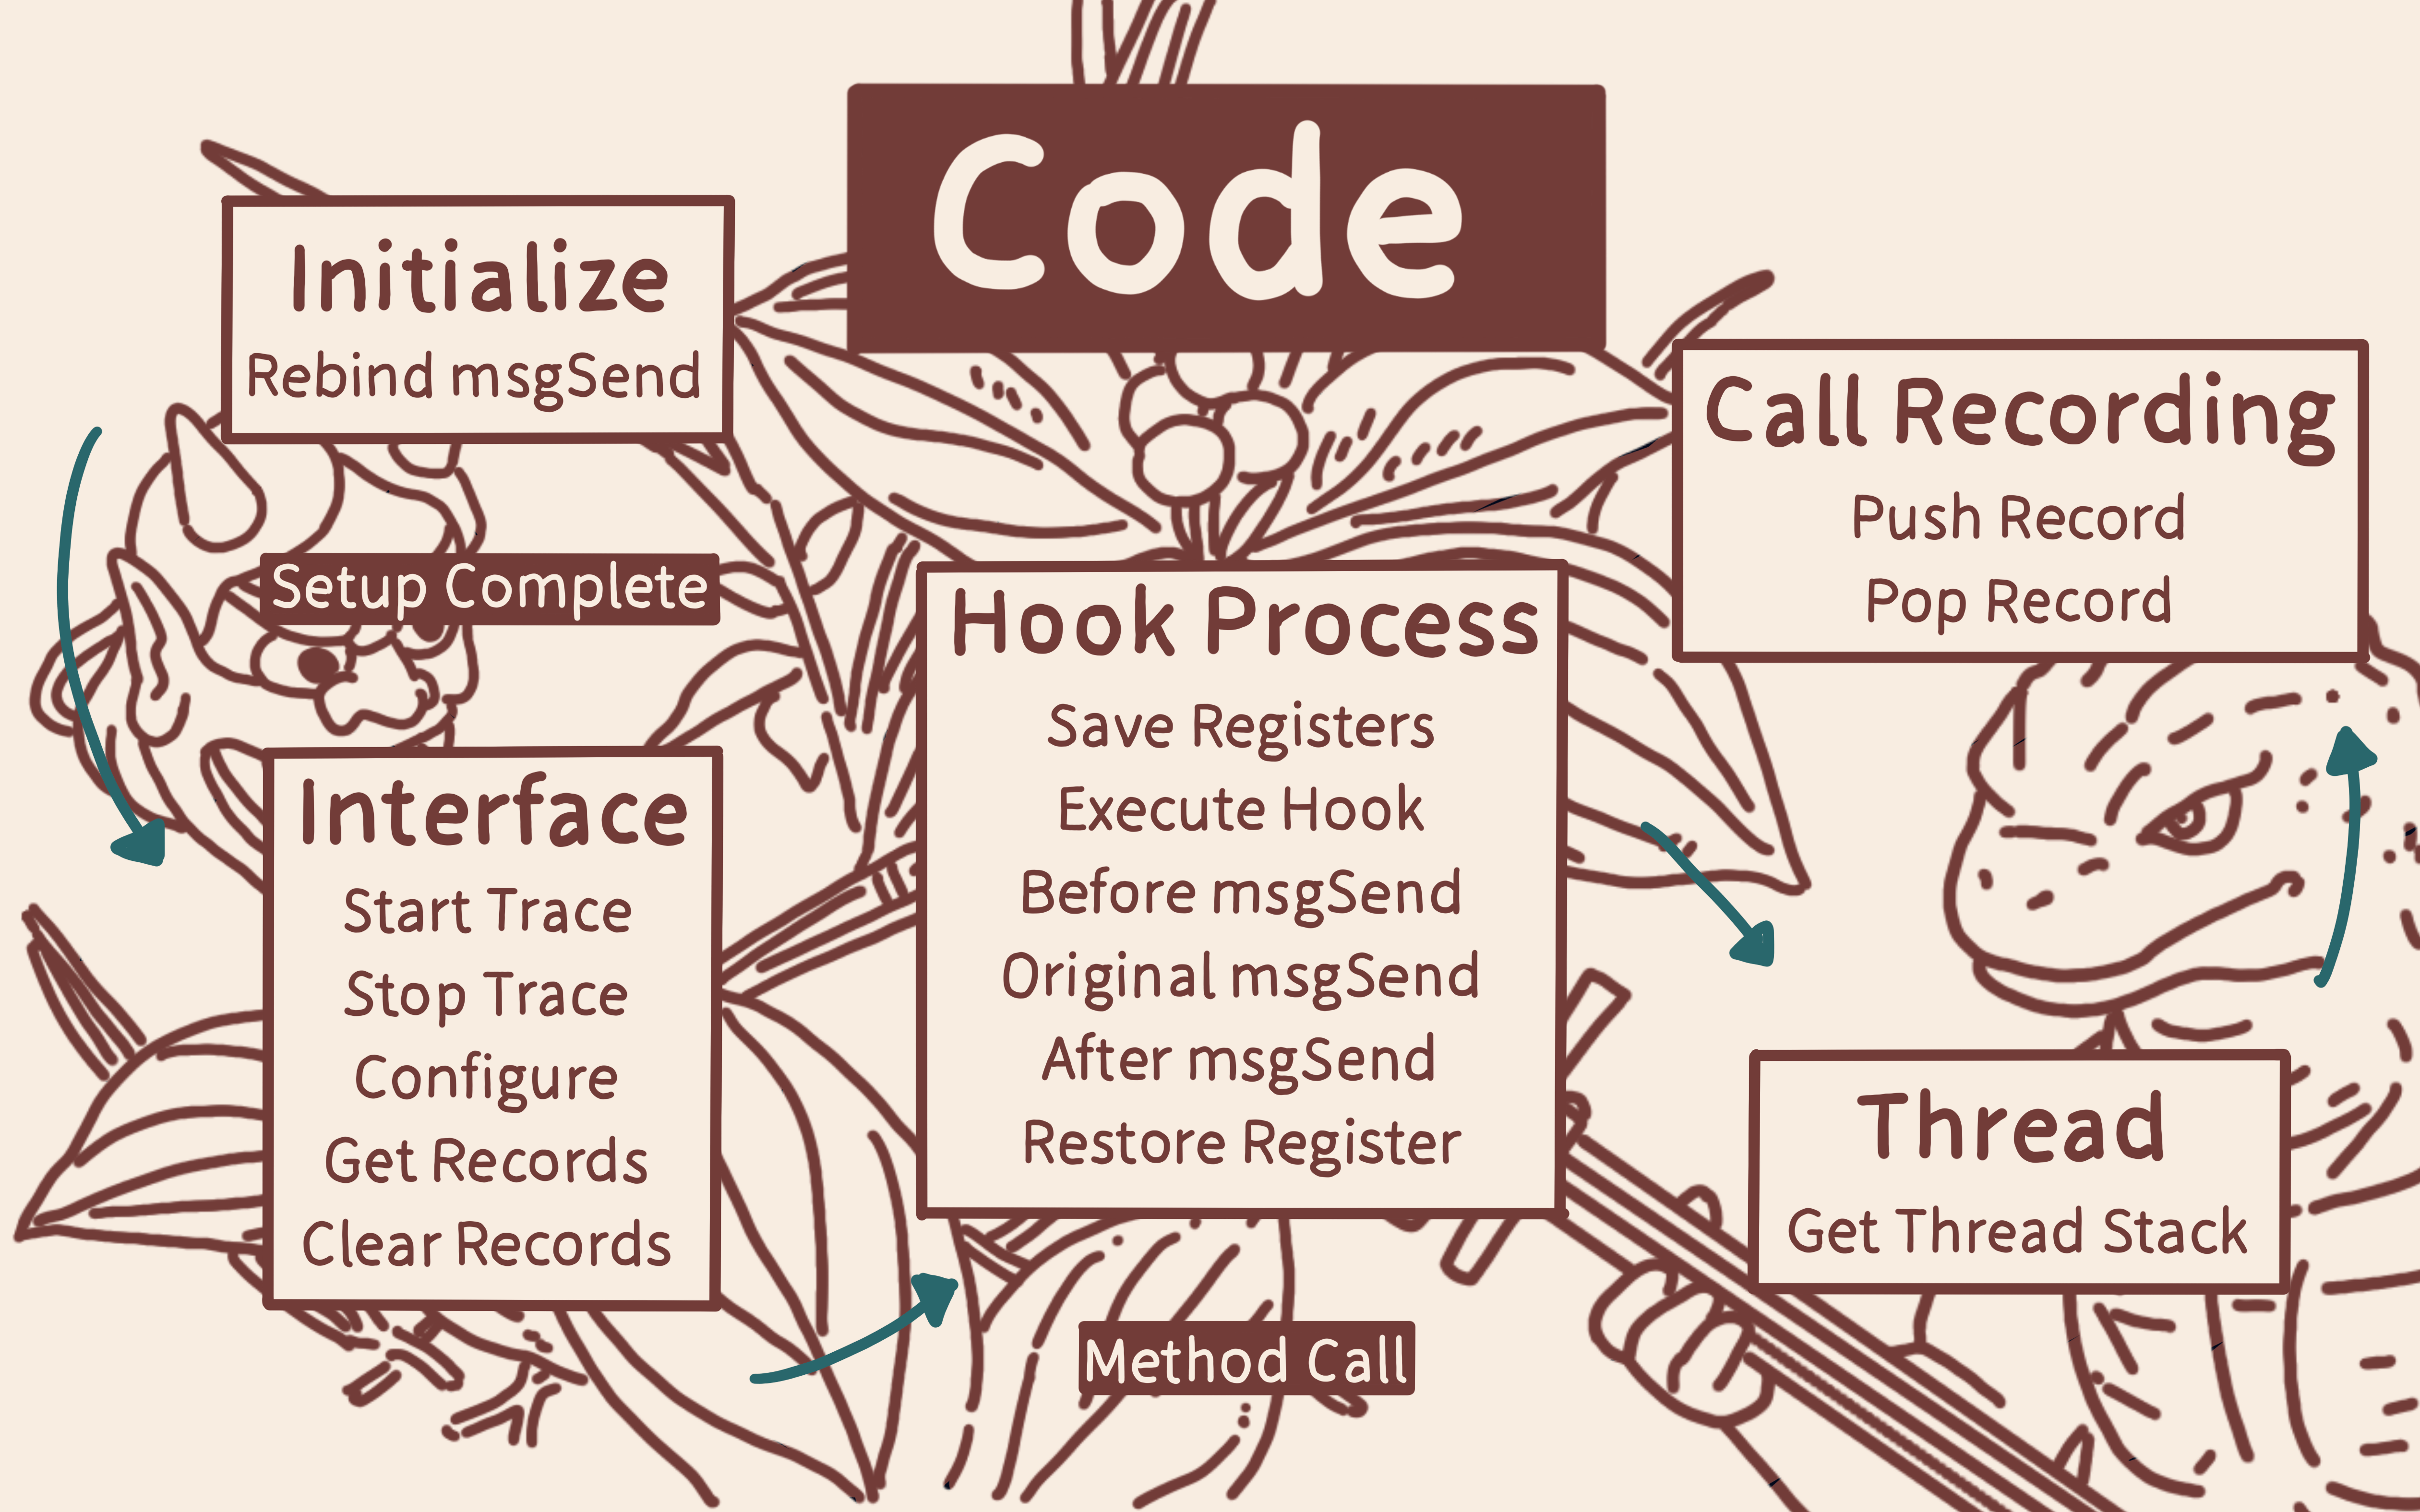
The code summary is shown in the diagram. We first replace objc_msgSend and calculate function execution time in the replacement. Then, we save the data and generate a report.
This is the method we use in our company to check startup time.
This method only works for tracking the execution time of Objective-C functions. But what about Swift functions?
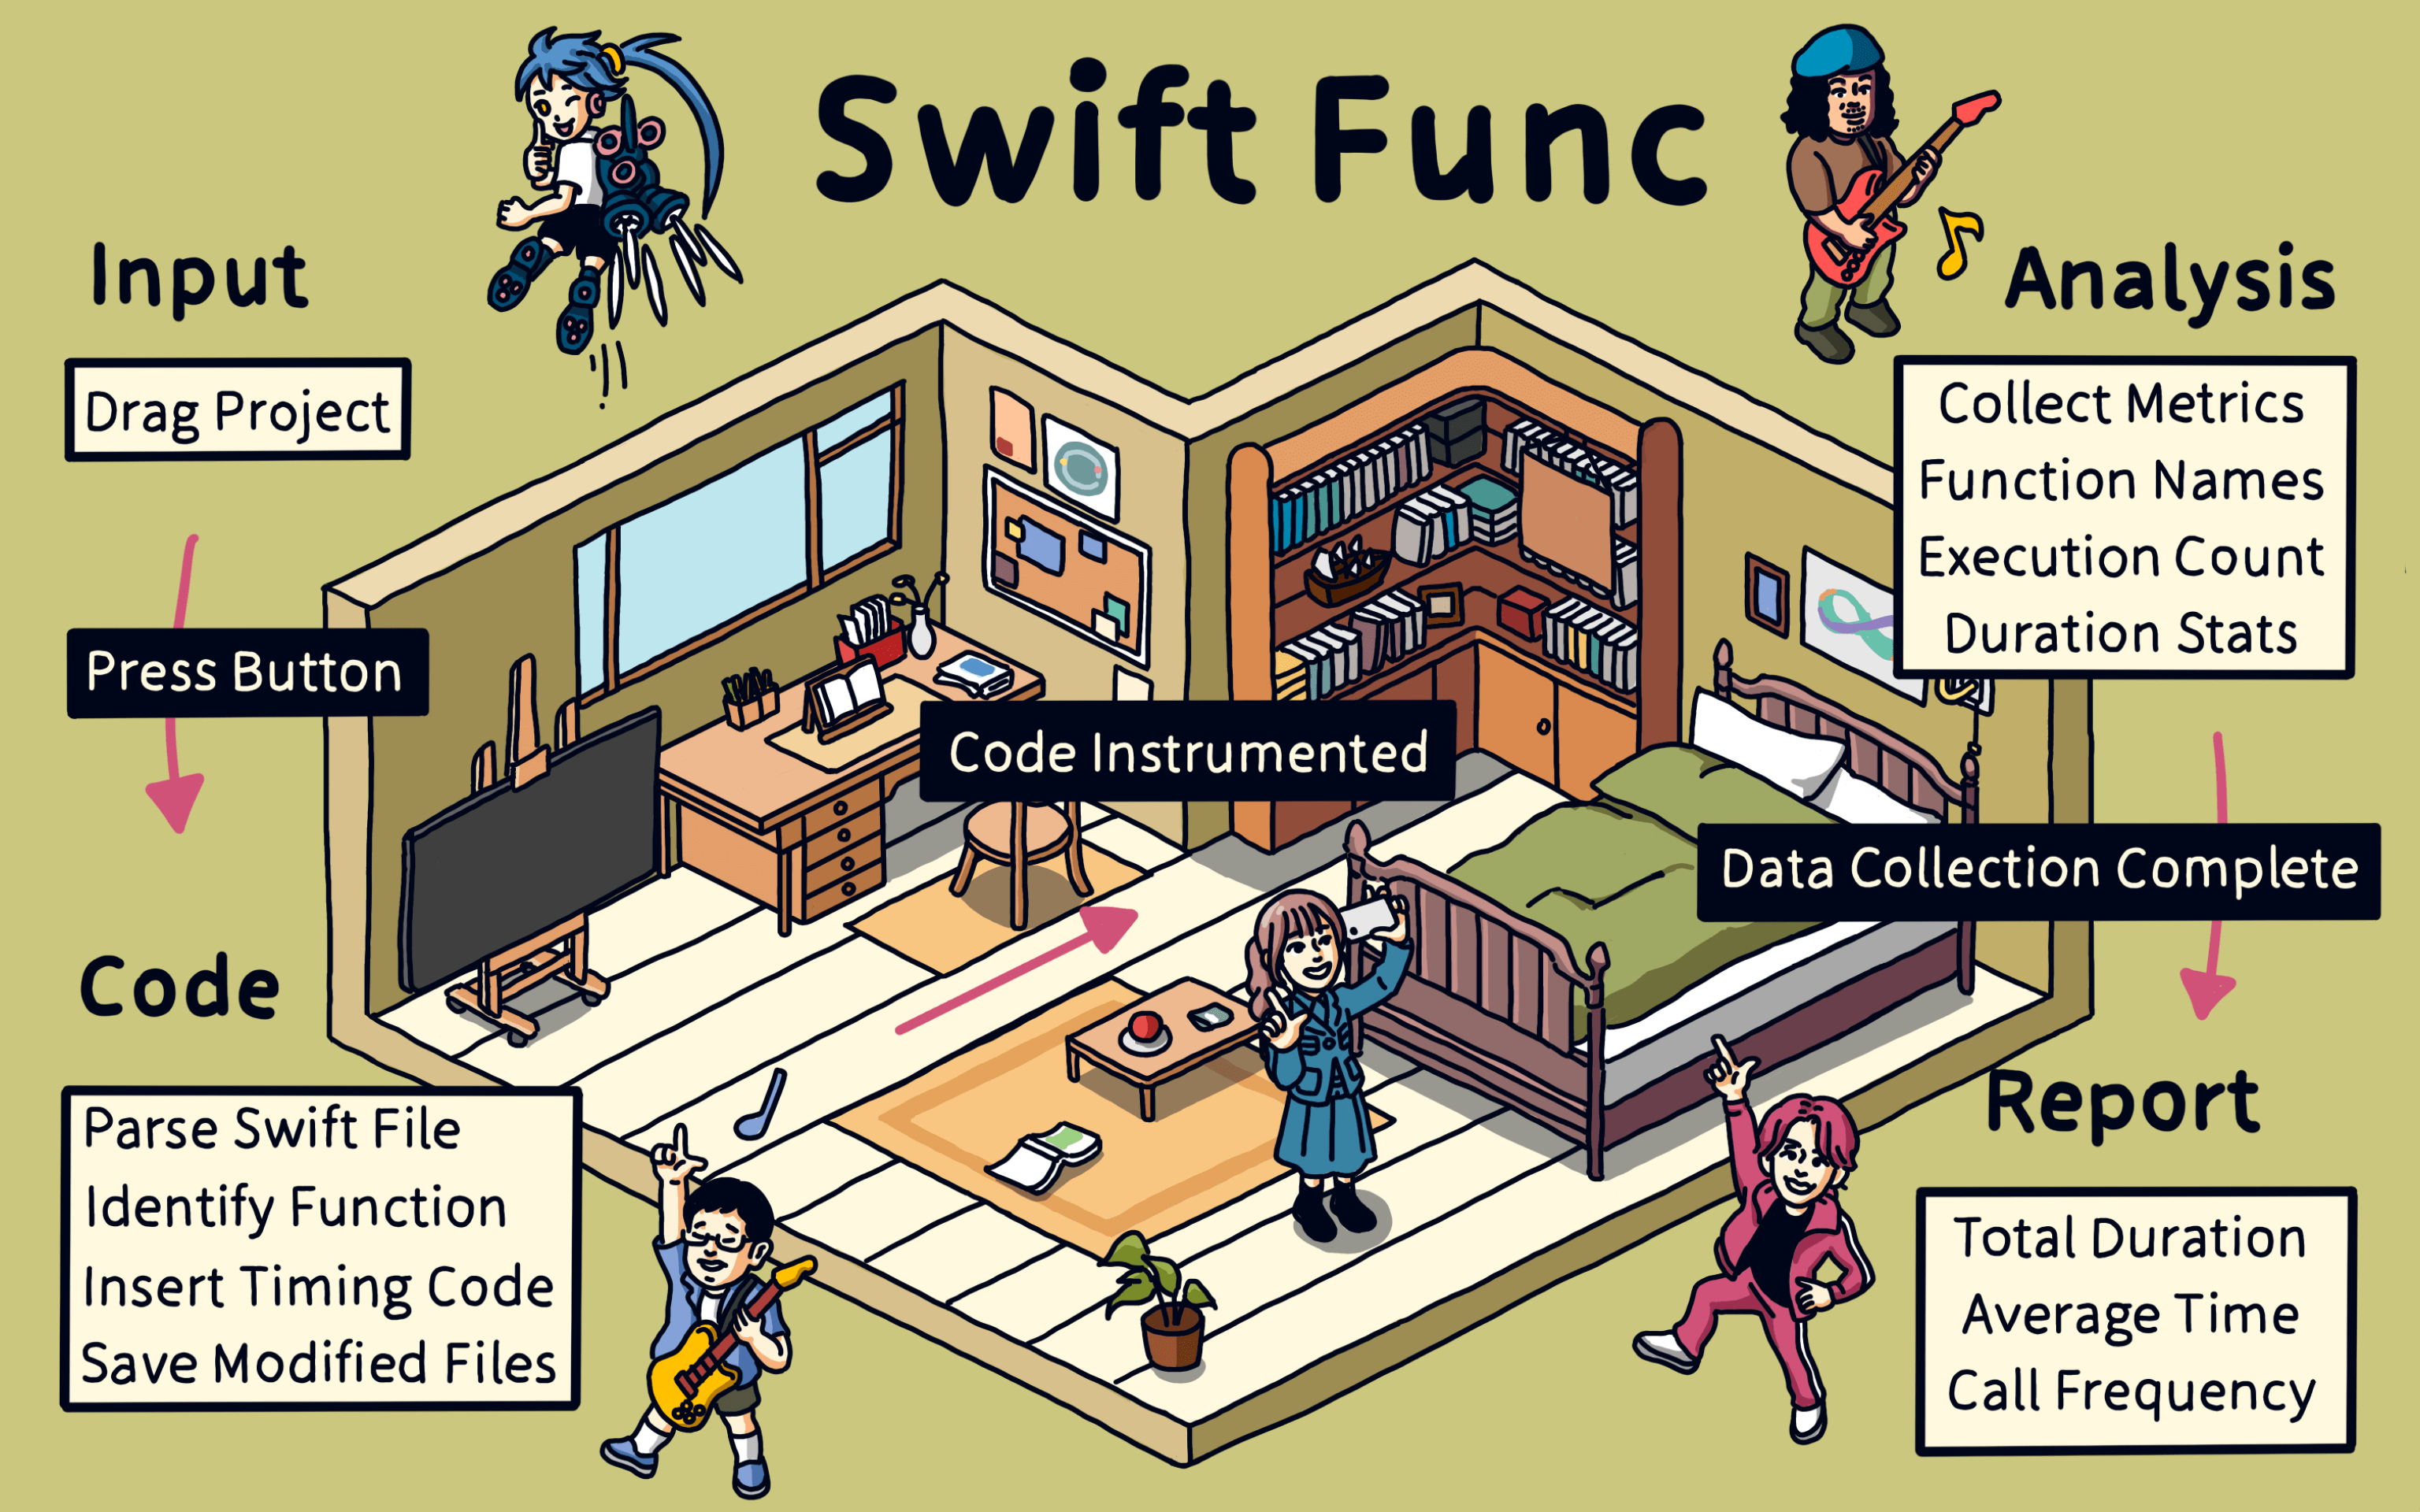
To track the runtime of Swift functions, I wrote a tool.
Simply drag your Swift project folder into the tool, click a button, and the tool will parse the Swift files in the project, find function definitions, and insert the time tracking code.
When your app runs, the tool starts collecting data, including function names, call counts, and execution times.
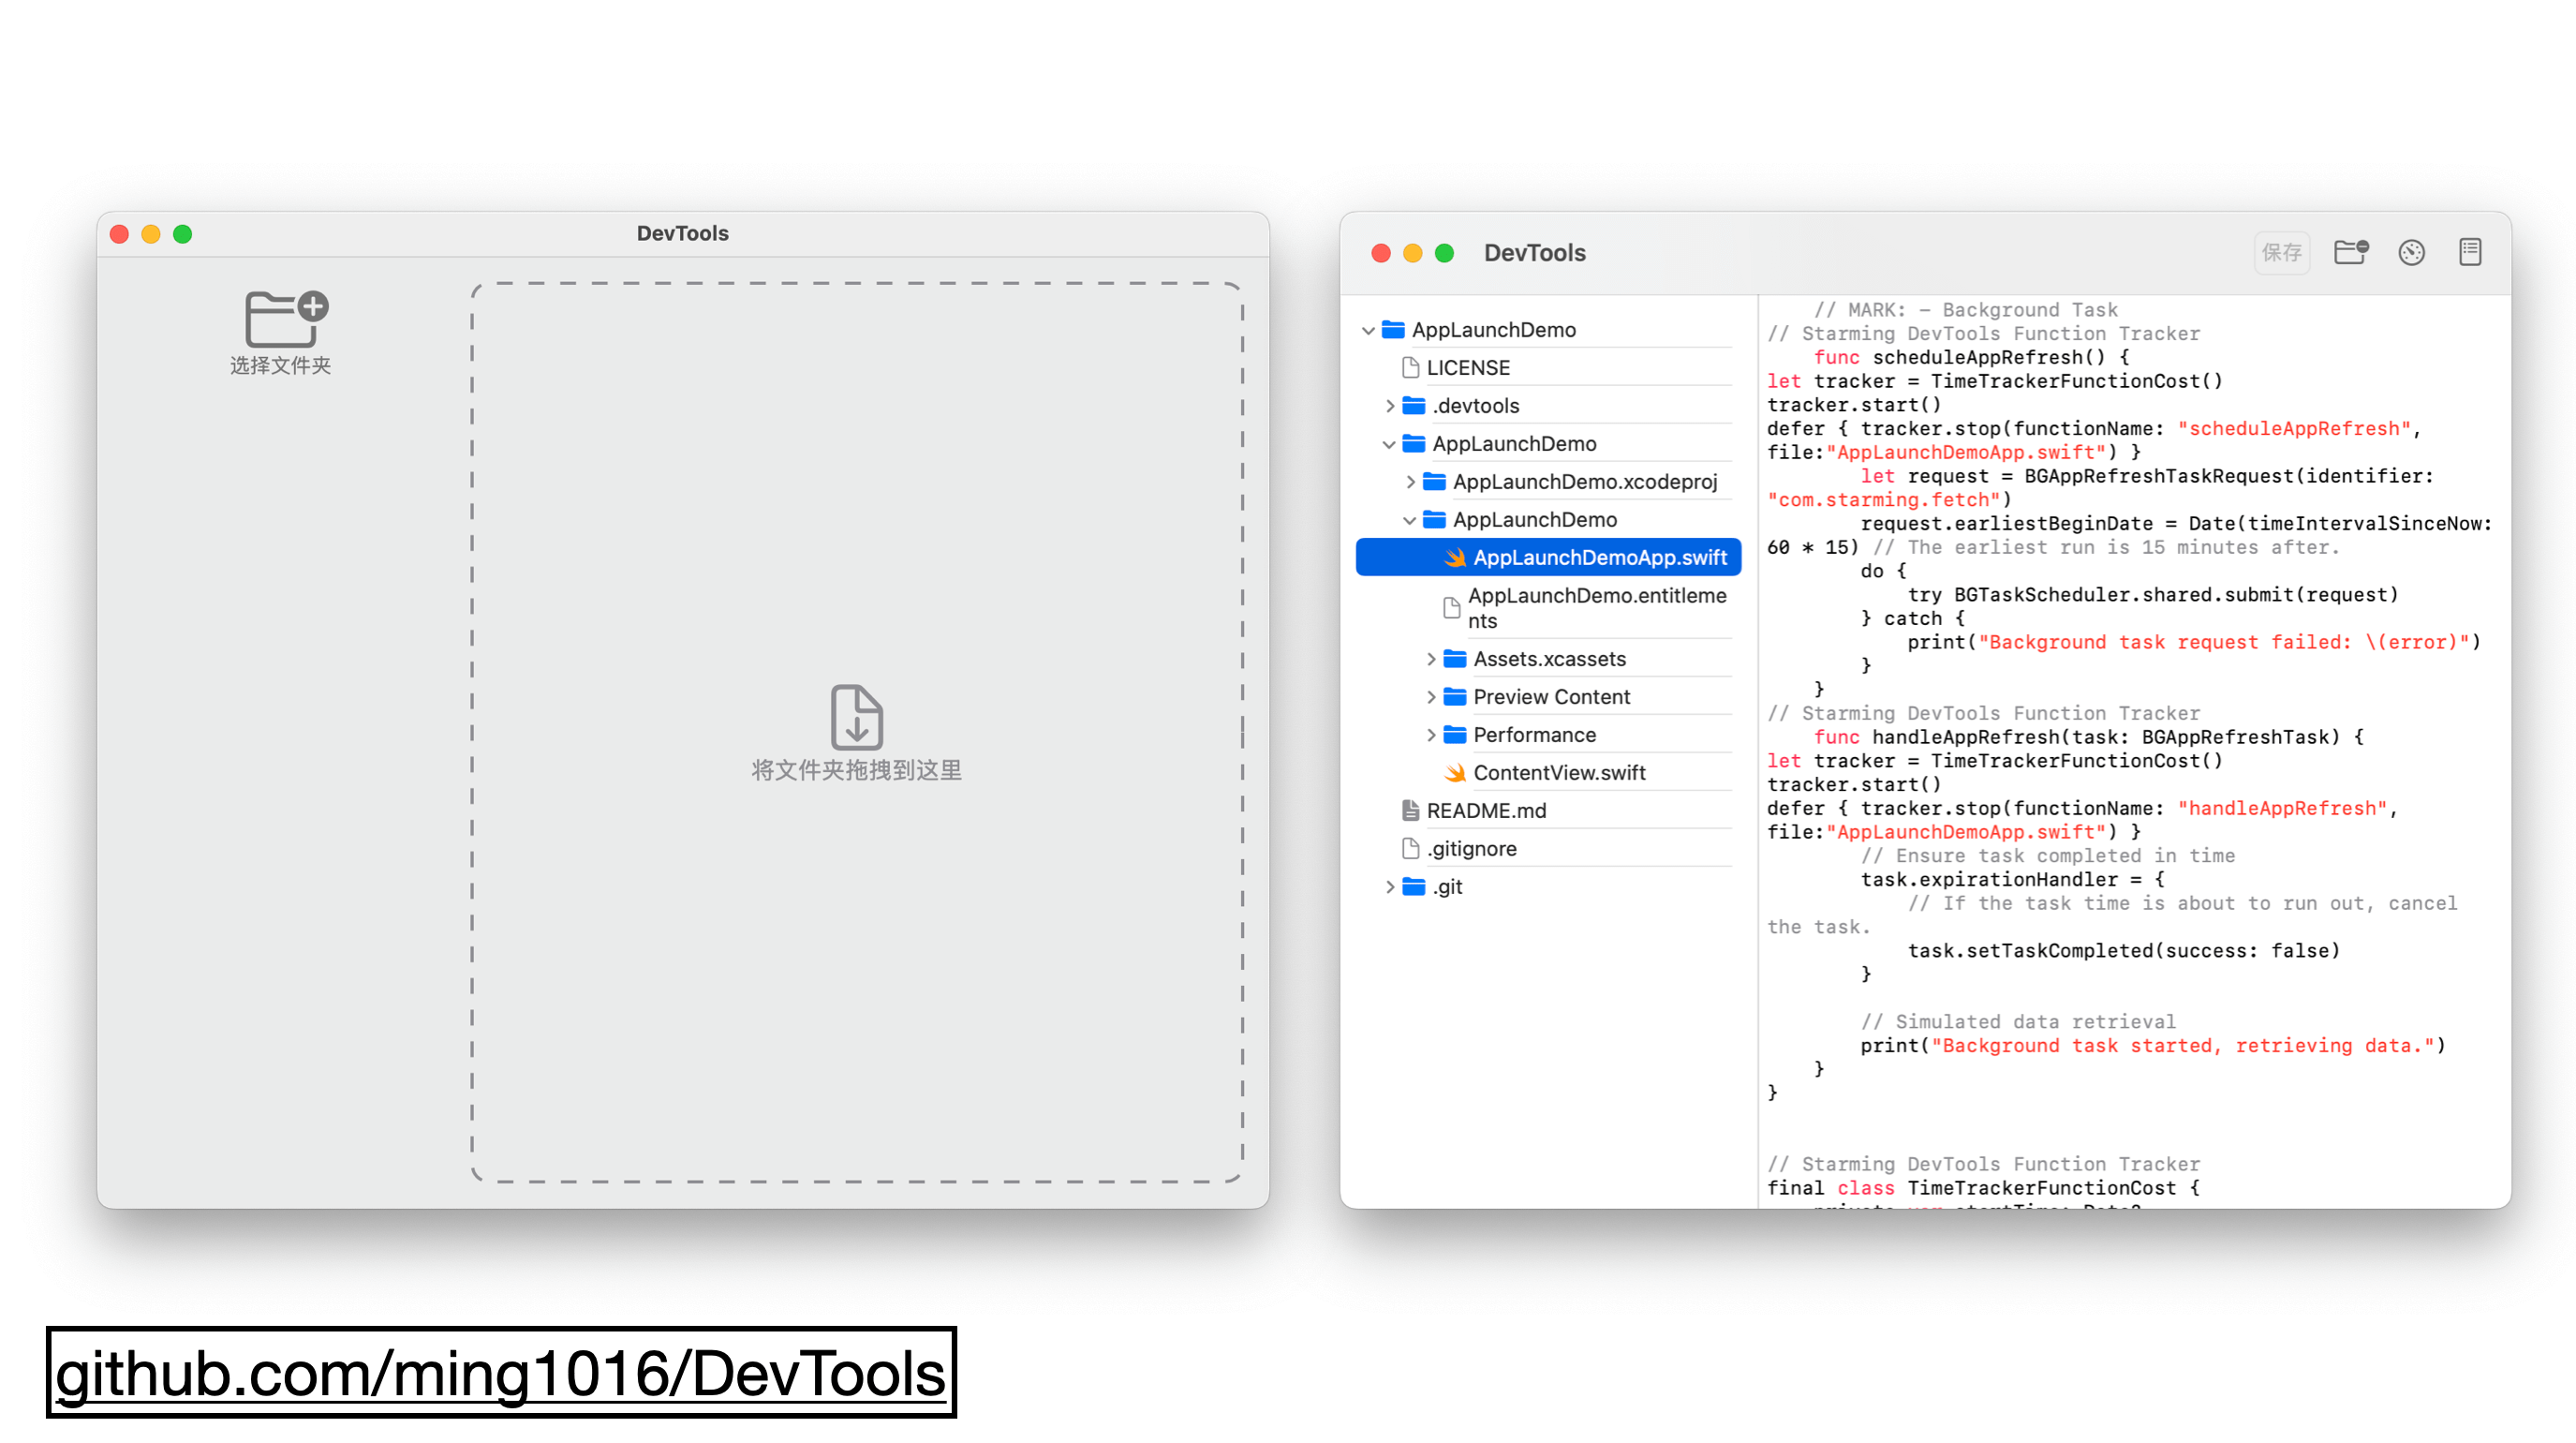
This is the tool’s interface. Just drag your project in. In the top right corner, there’s a button for time tracking. Click it, and it will insert the tracking code.
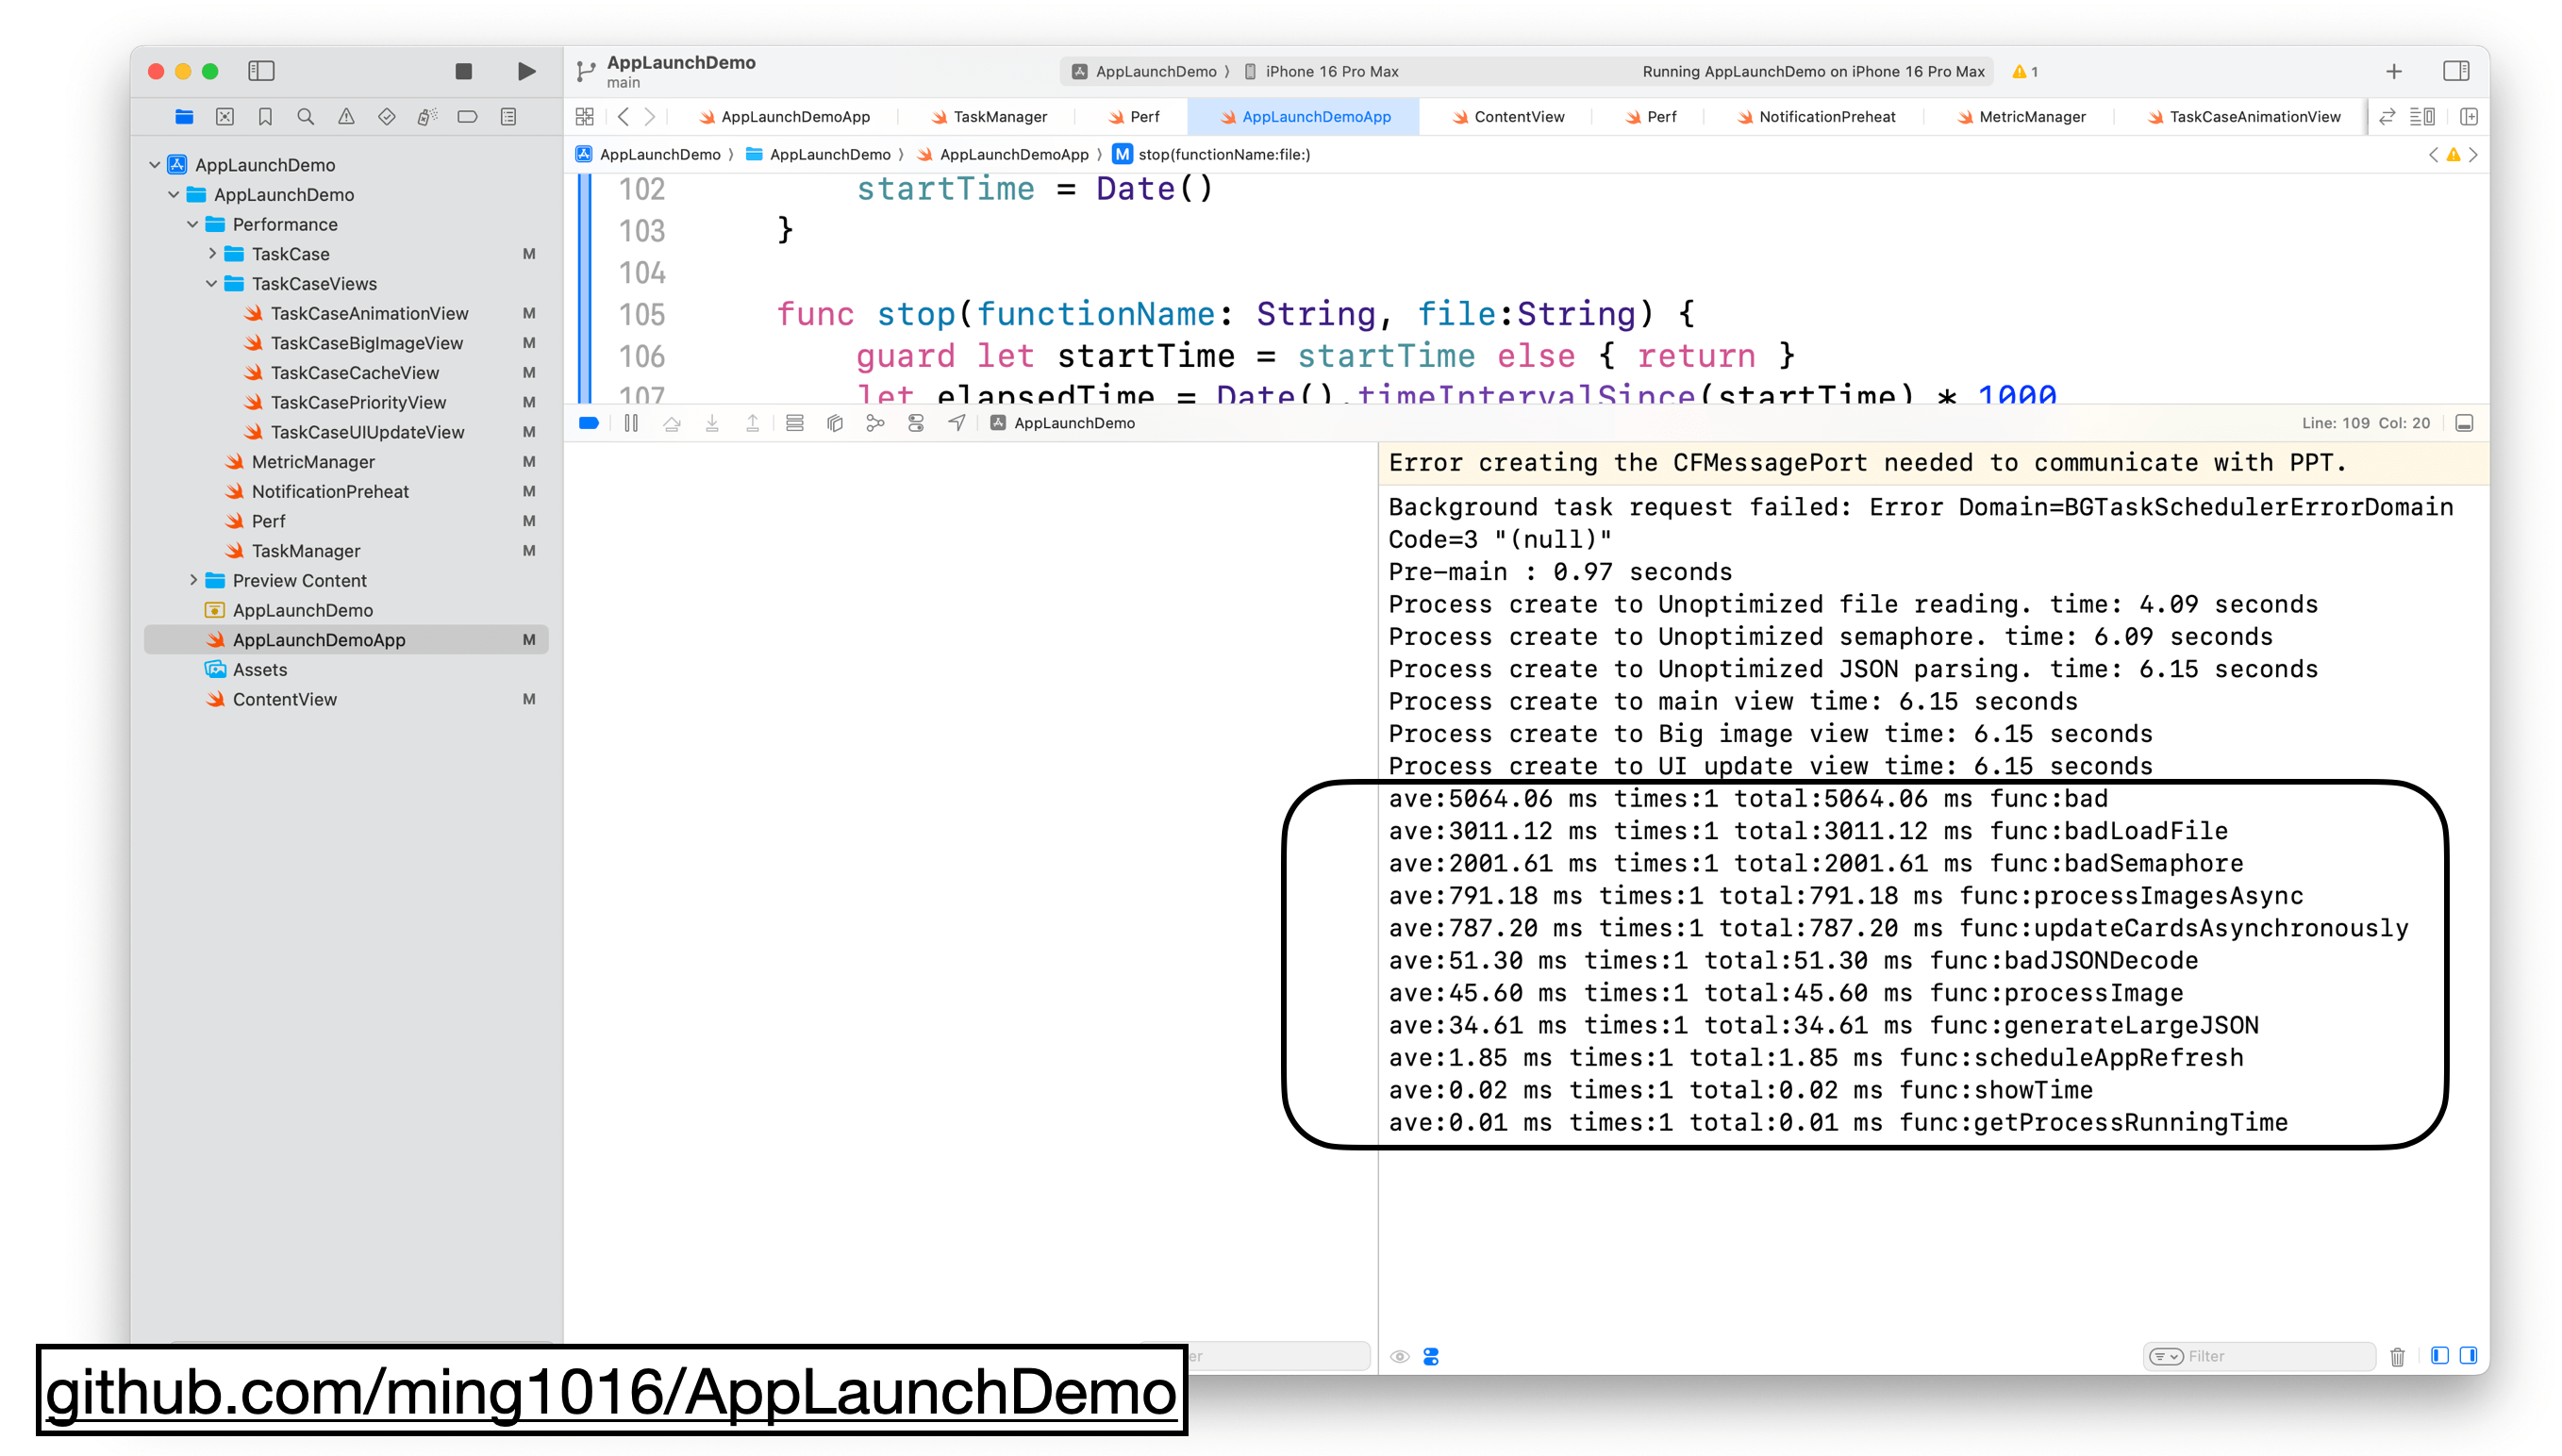
Once your project runs, the tool will sort the function’s execution time, showing the average time, call count, and total time for each function.
From what we’ve covered so far, we know how to identify where startup time is spent.
There are a few common issues that can impact launch time.
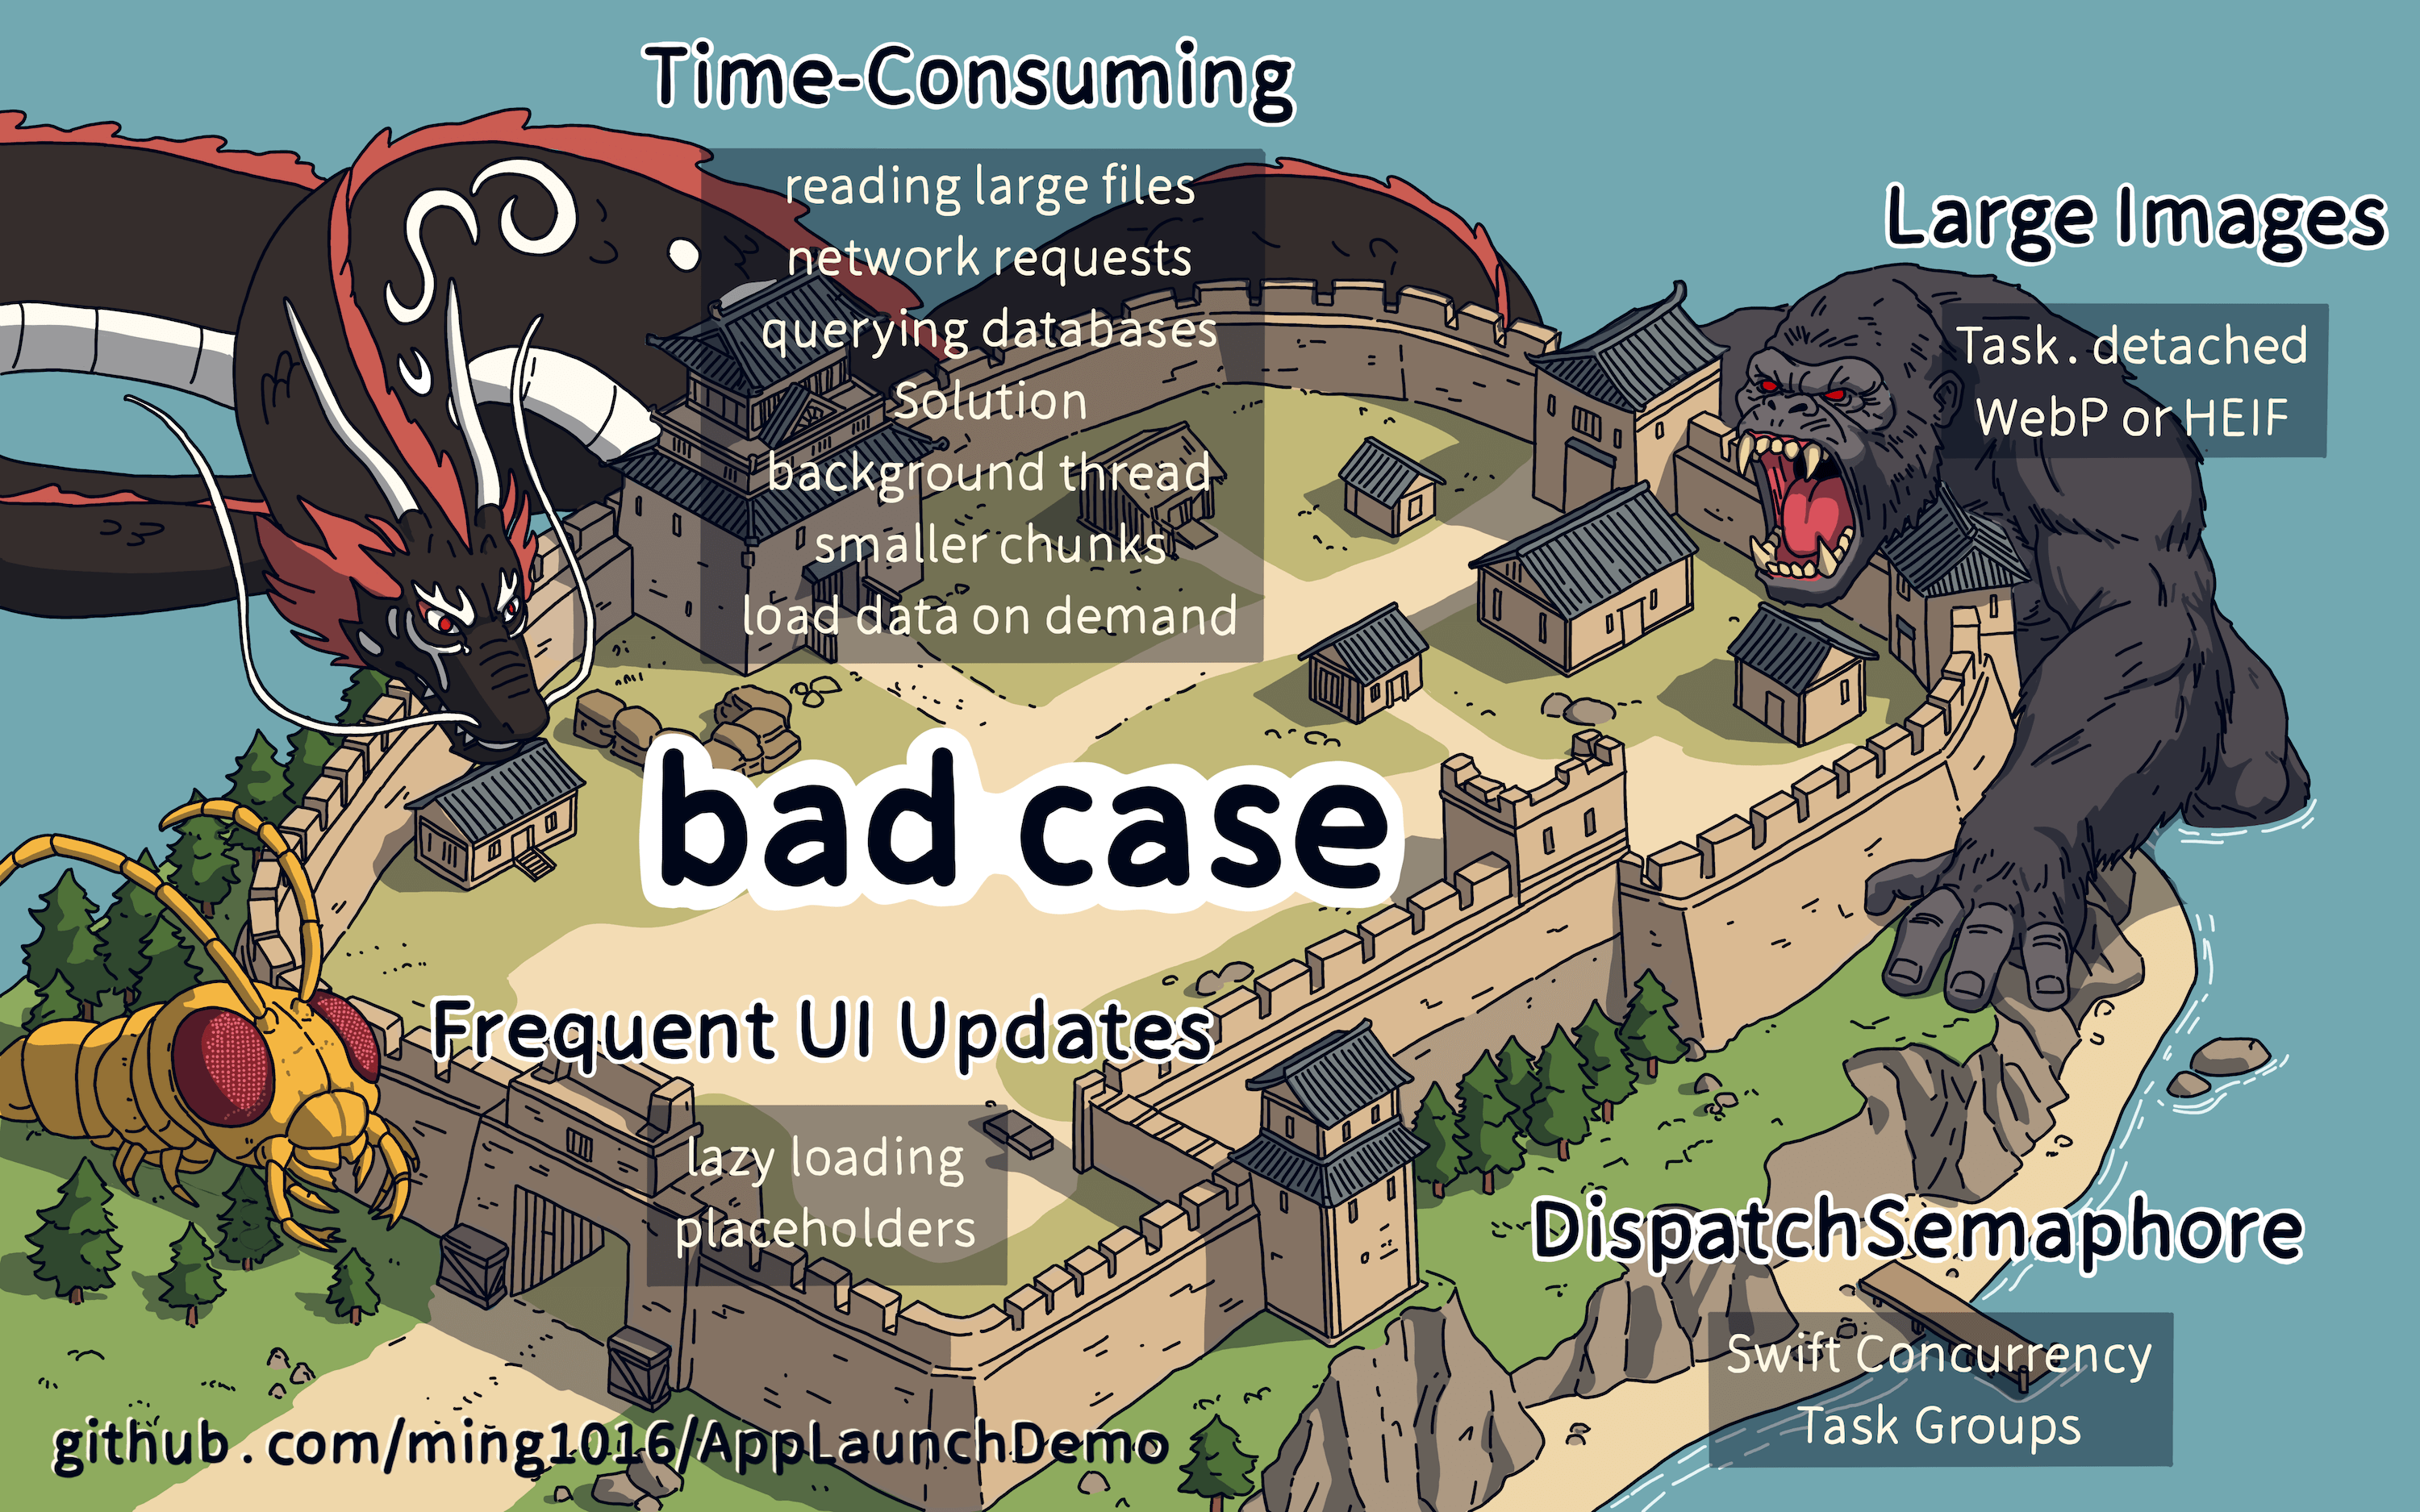
There are several common situations that can affect function execution time, as shown in the image.
The first one is expensive operations, like reading large files, making network requests, or querying the database.
The solution here is to move these operations to the background or break them into smaller tasks that run as needed.
The second issue is displaying large images. You can asynchronously load and decode large images using Swift Concurrency, or use more optimized formats to reduce I/O and memory usage.
The third issue is frequent UI updates. The solution is to use lazy loading to only update the UI visible on the screen, and use default placeholders for UI elements off-screen.
The last issue is DispatchSemaphore, which can block the main thread. The solution is to use Swift Concurrency’s Task Group, move the wait into async tasks, and free up the main thread.
The relevant examples and solutions are available in the link below.
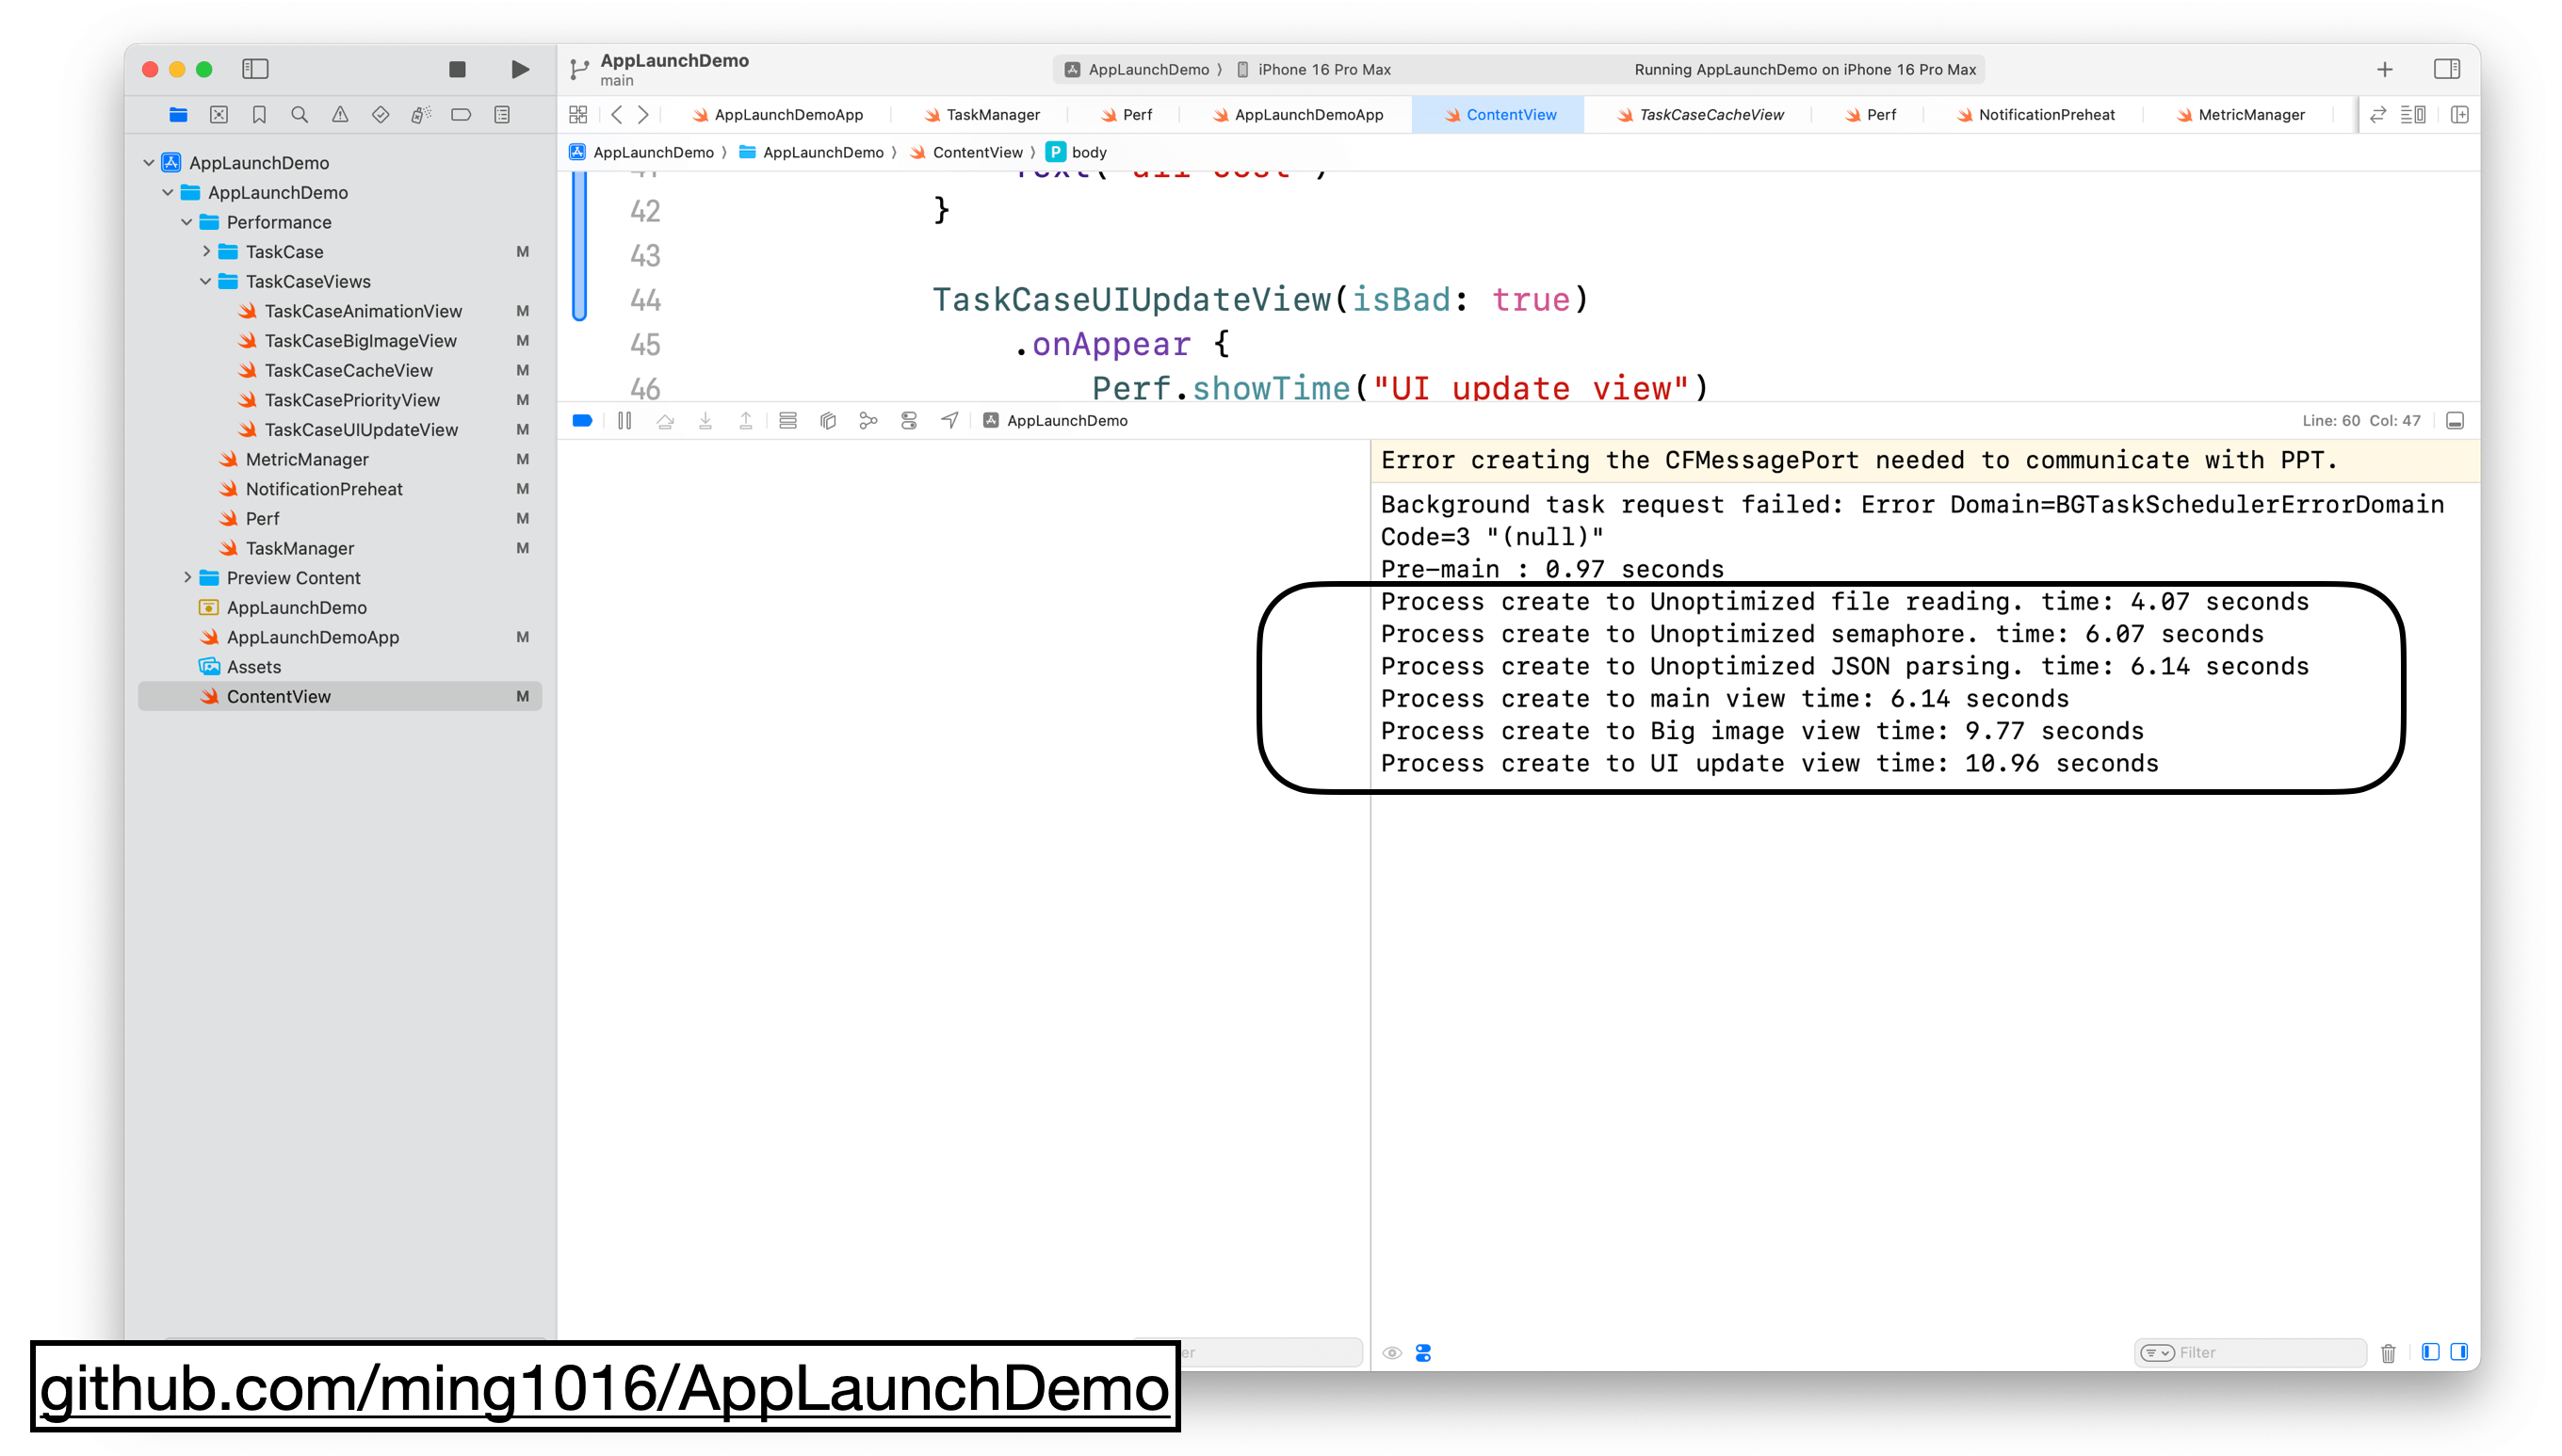
In the demo app, I’ve included all the bad cases. The app’s launch time was huge, over 10 seconds.
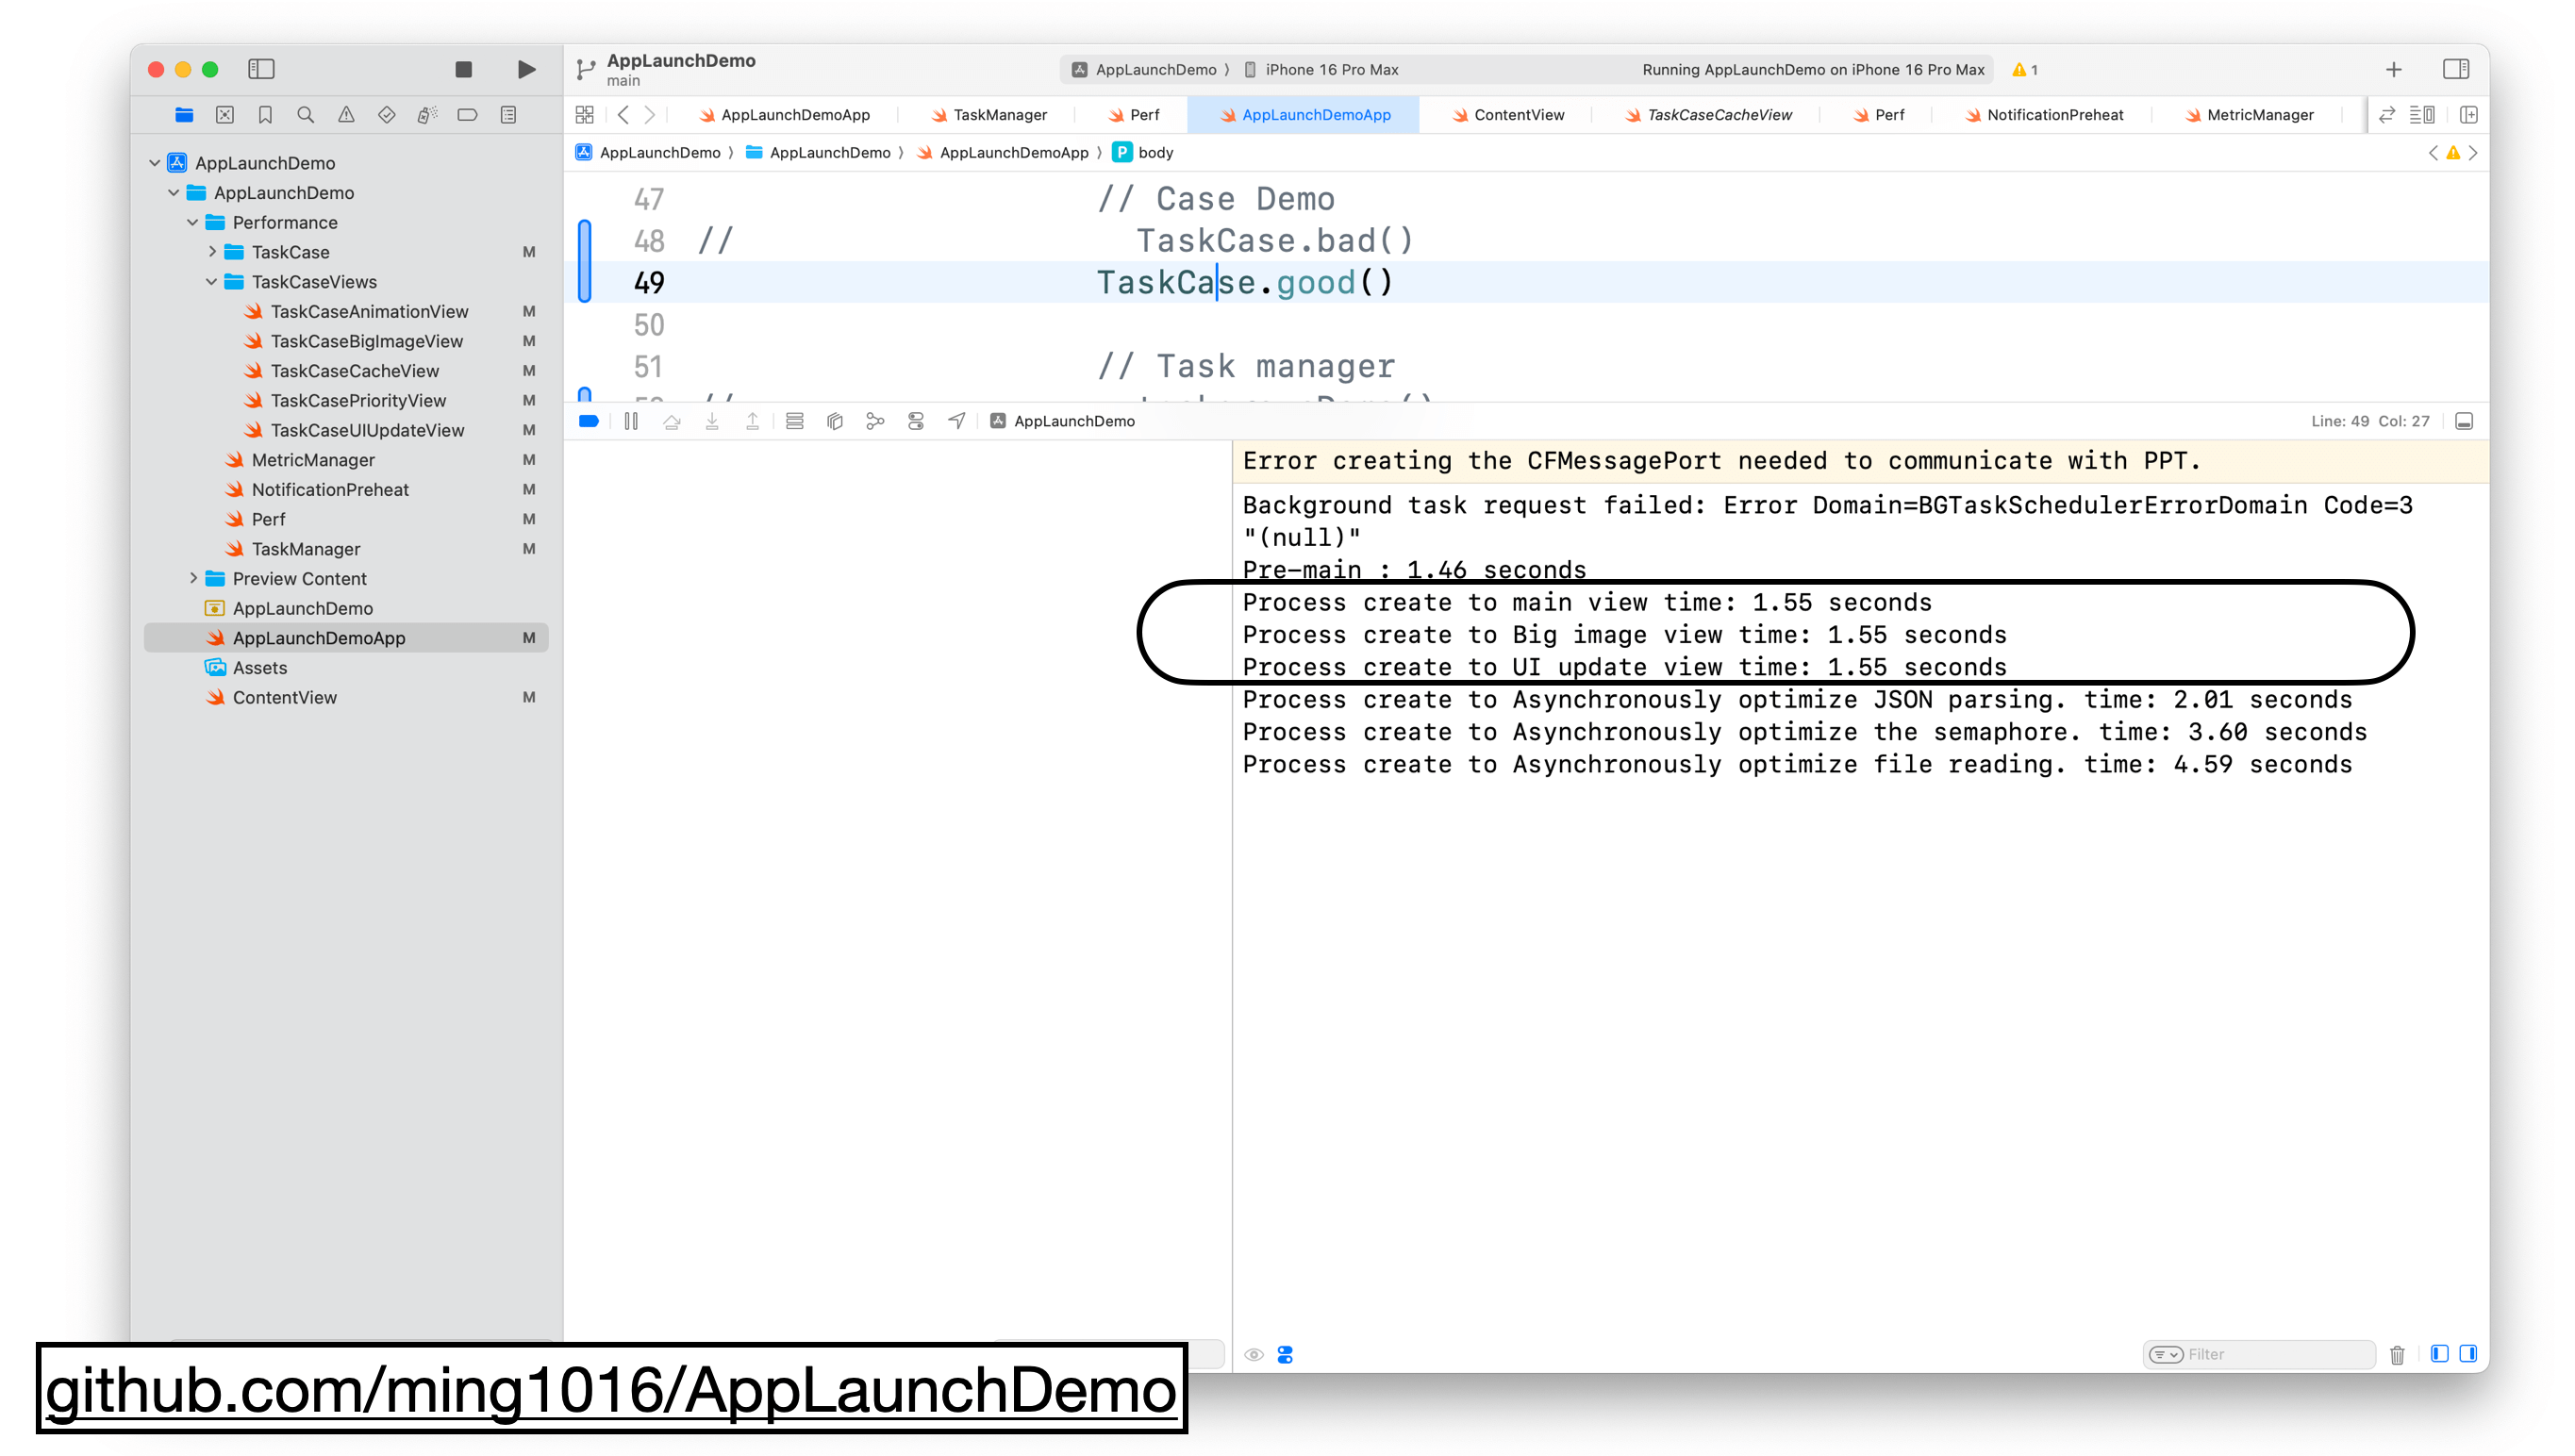
After optimizing the code, the main thread finish time is down to just 1 second, and the async completion time is also much shorter.
You definitely want to download this demo and see the difference before and after optimization. The link is below on this page.

We’ve used tools to pinpoint startup issues, and now we’ve solved those costly problems.
But can we further reduce the startup time?
Next, I’ll introduce two more techniques that can reduce startup time even further: optimizing the launch path and merging libraries.
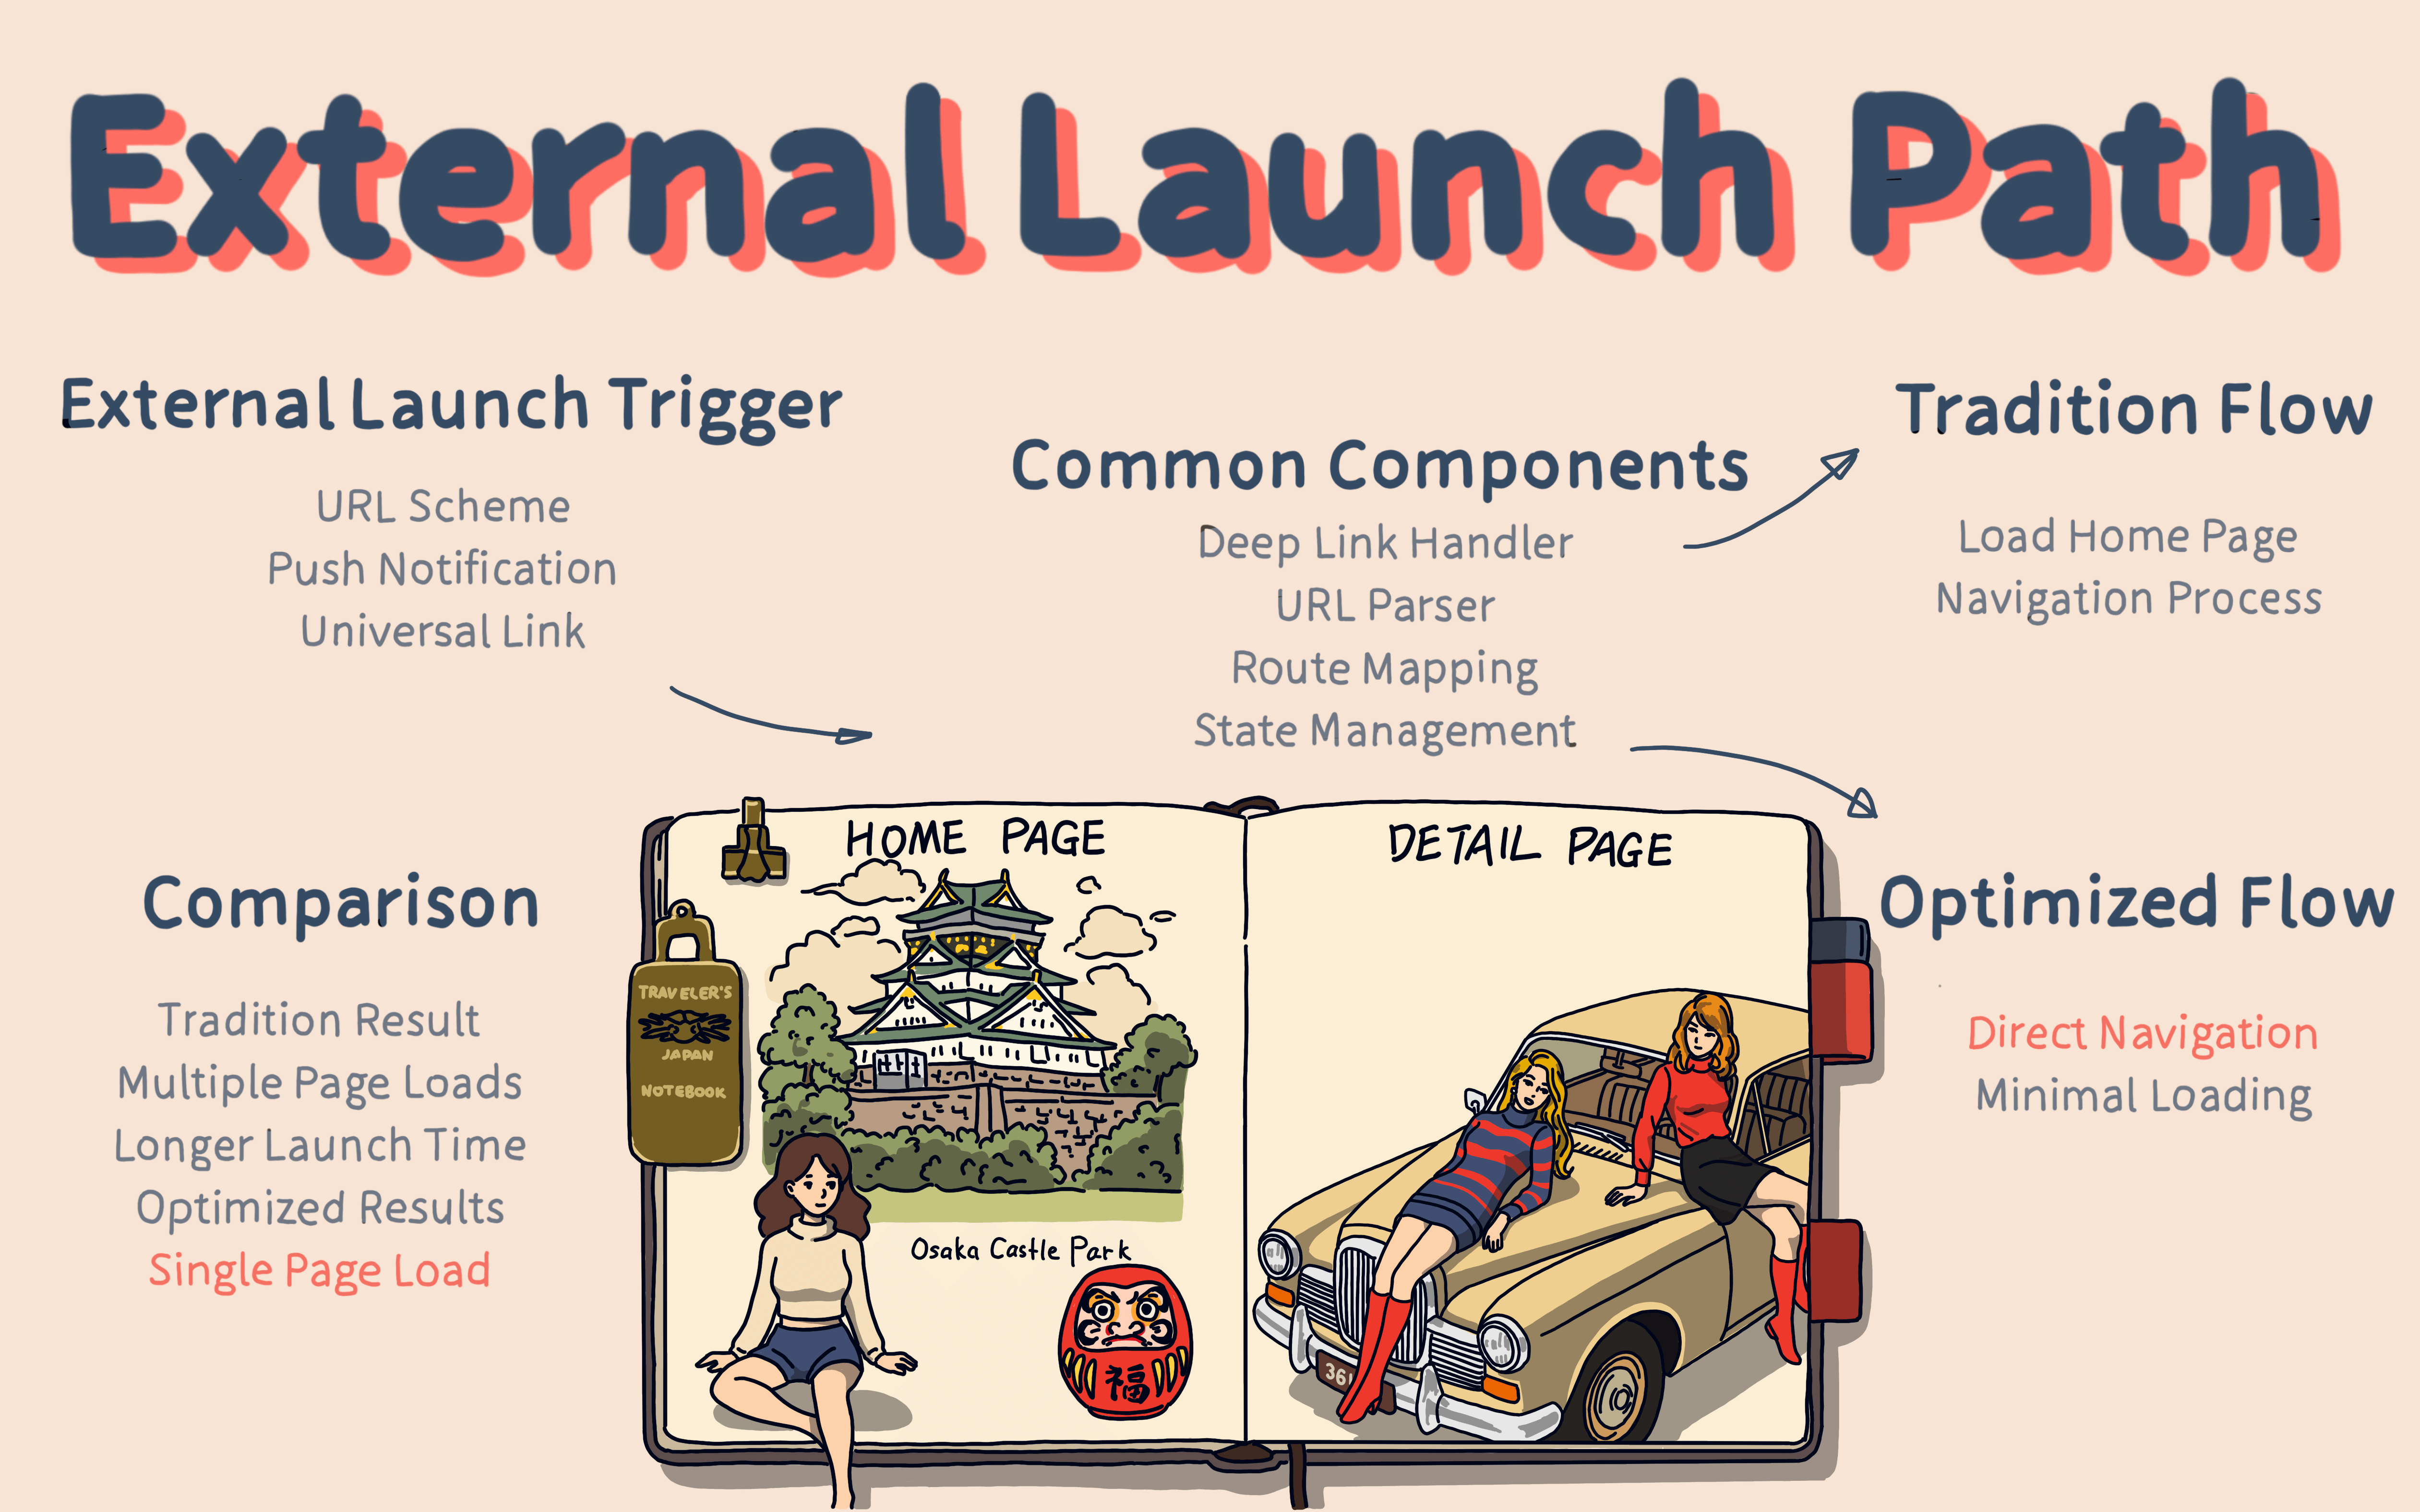
The principle of Launch Path optimization is that when an external launch is triggered, we bypass the home page’s reading and rendering, directly opening the target page.
The benefit of this approach is that it saves the overhead of reading and rendering the home page.
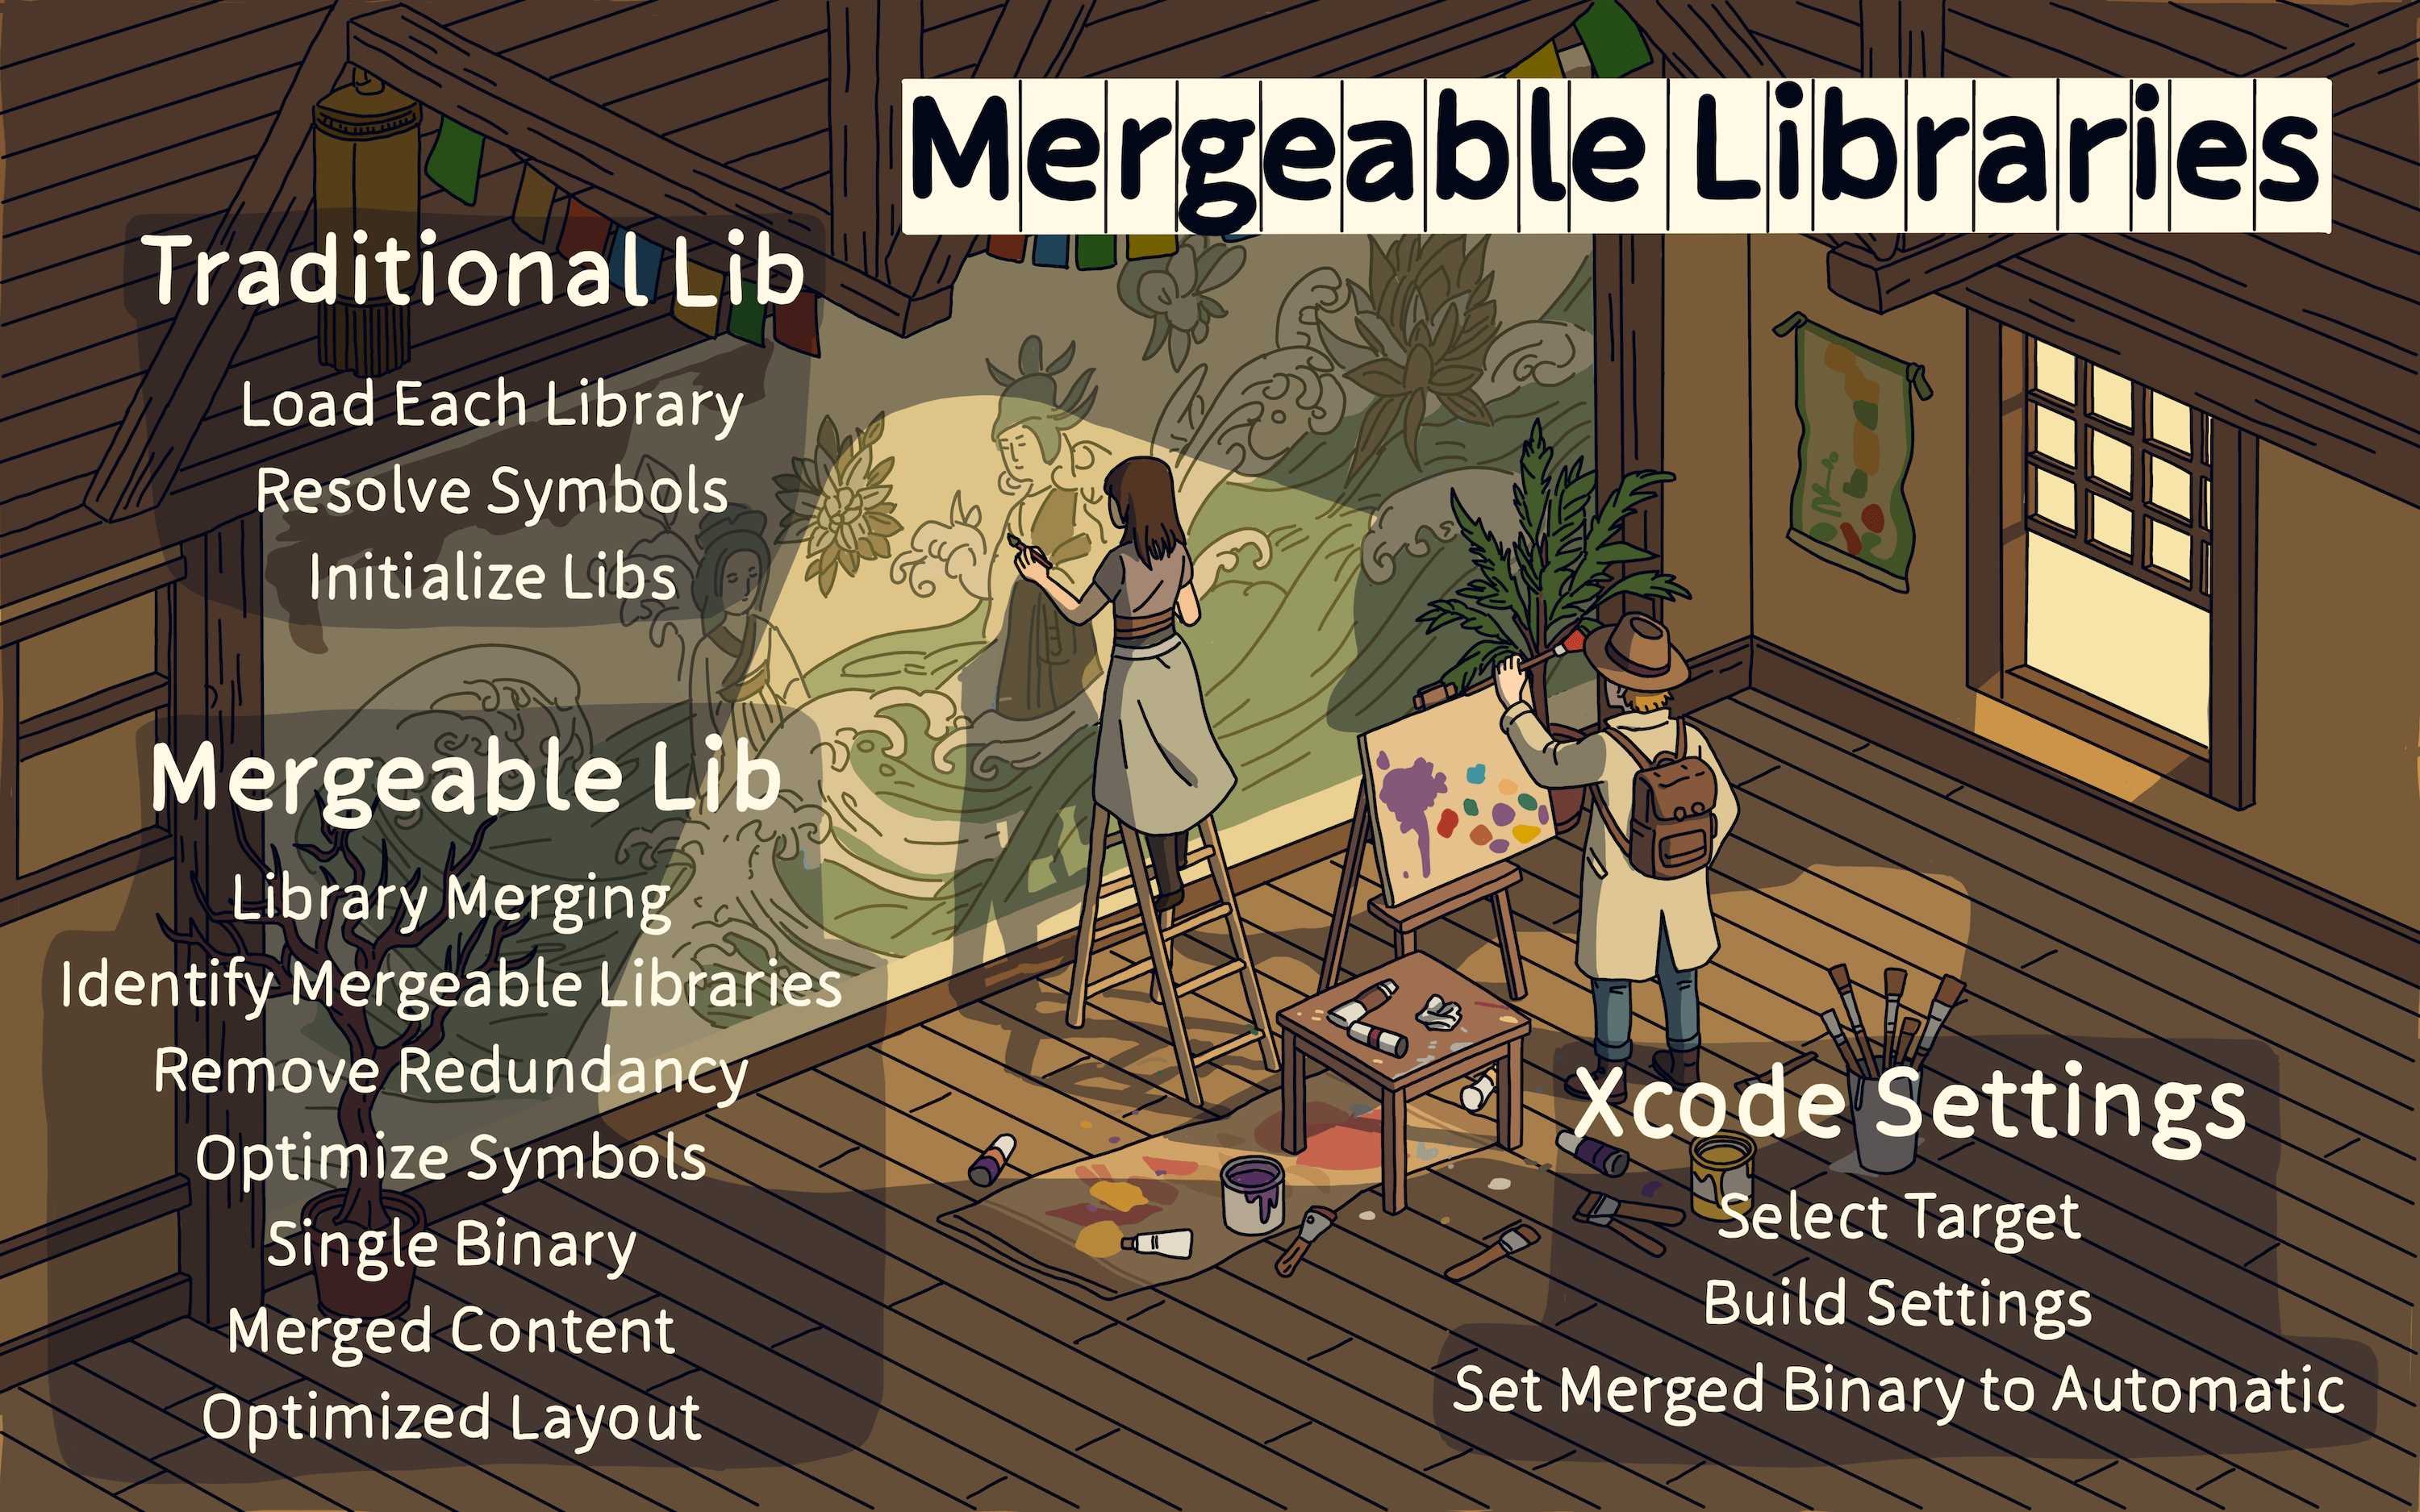
Next is the Mergeable Libraries optimization technique.
Traditionally, dynamic libraries were loaded one by one, processing symbols and then initializing each library.
With Mergeable Libraries, dynamic libraries are merged, removing redundant and duplicate symbols, and turning them into static libraries.
This is a new feature in Xcode that can be enabled through Build Settings.
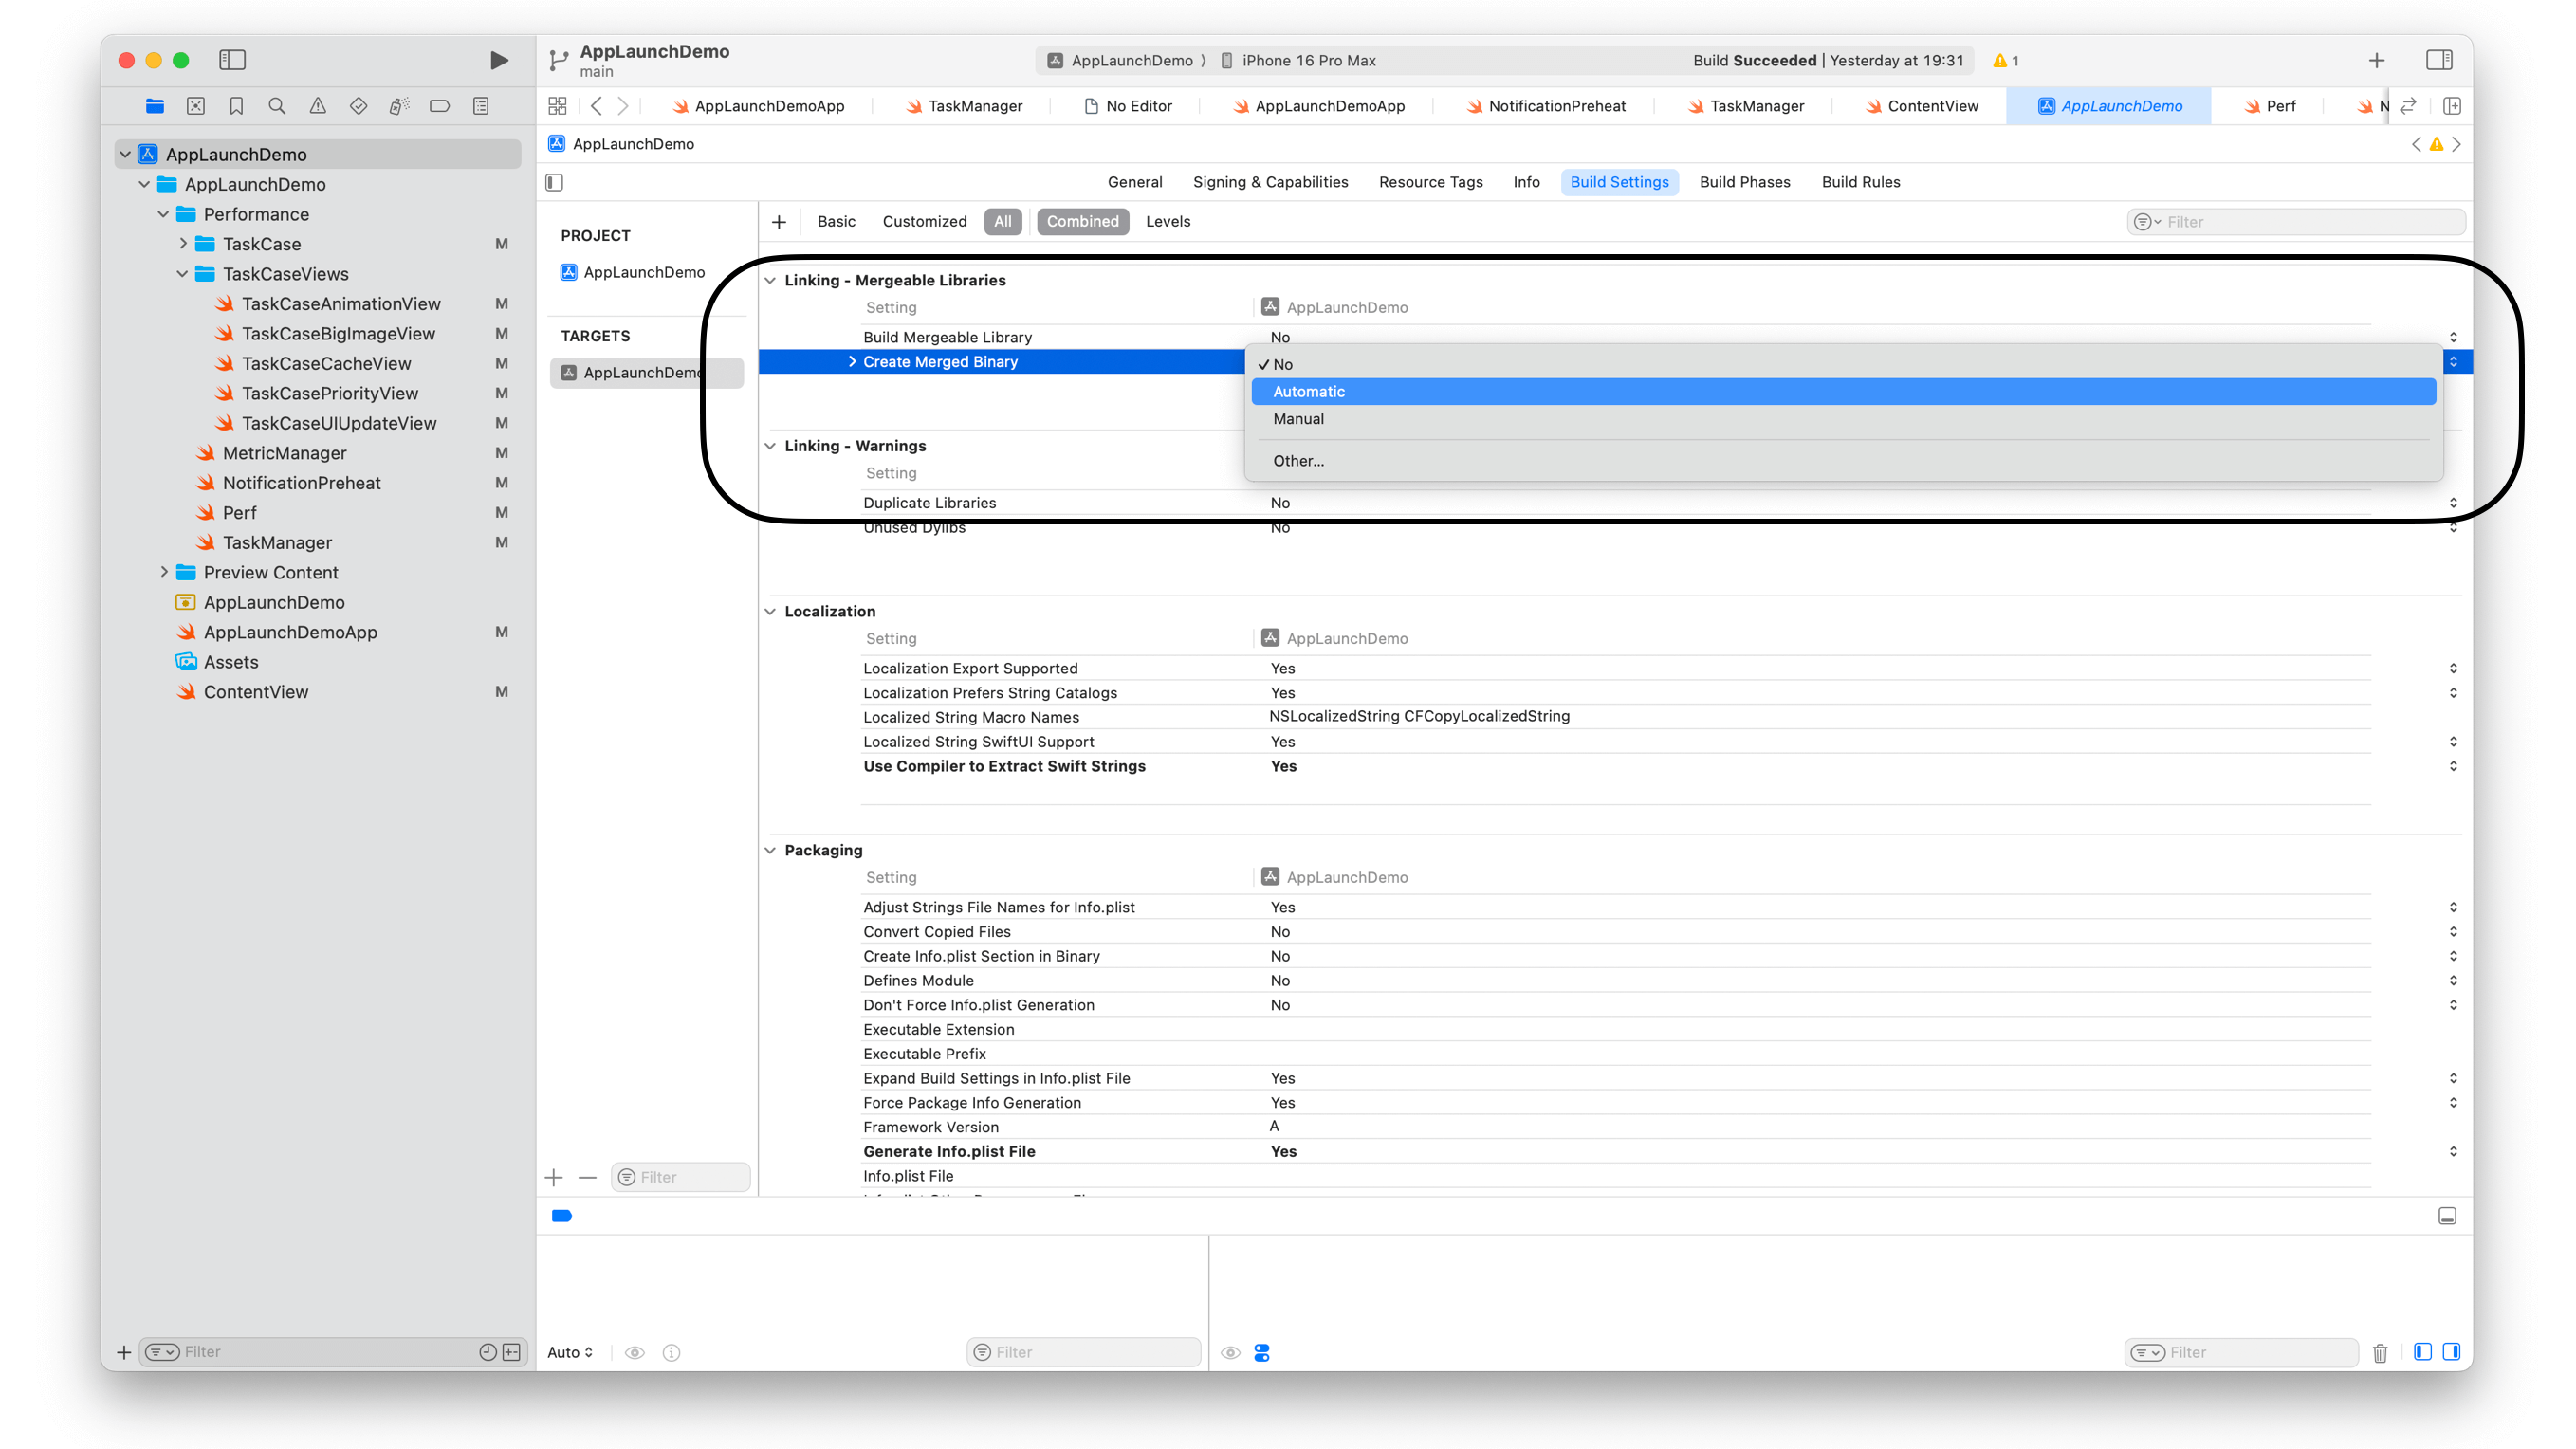
In Build Settings, you can find the “Merged Binary” option and set it to “Automatic.”
At this point, we’ve identified the problems and understand how to address them. We also know how to further reduce startup time.
However, as the app evolves, the tasks that run during startup can become more complex and numerous.
We need a way to manage these tasks effectively, so we can control the system resource usage during startup and prevent the launch time from getting worse.
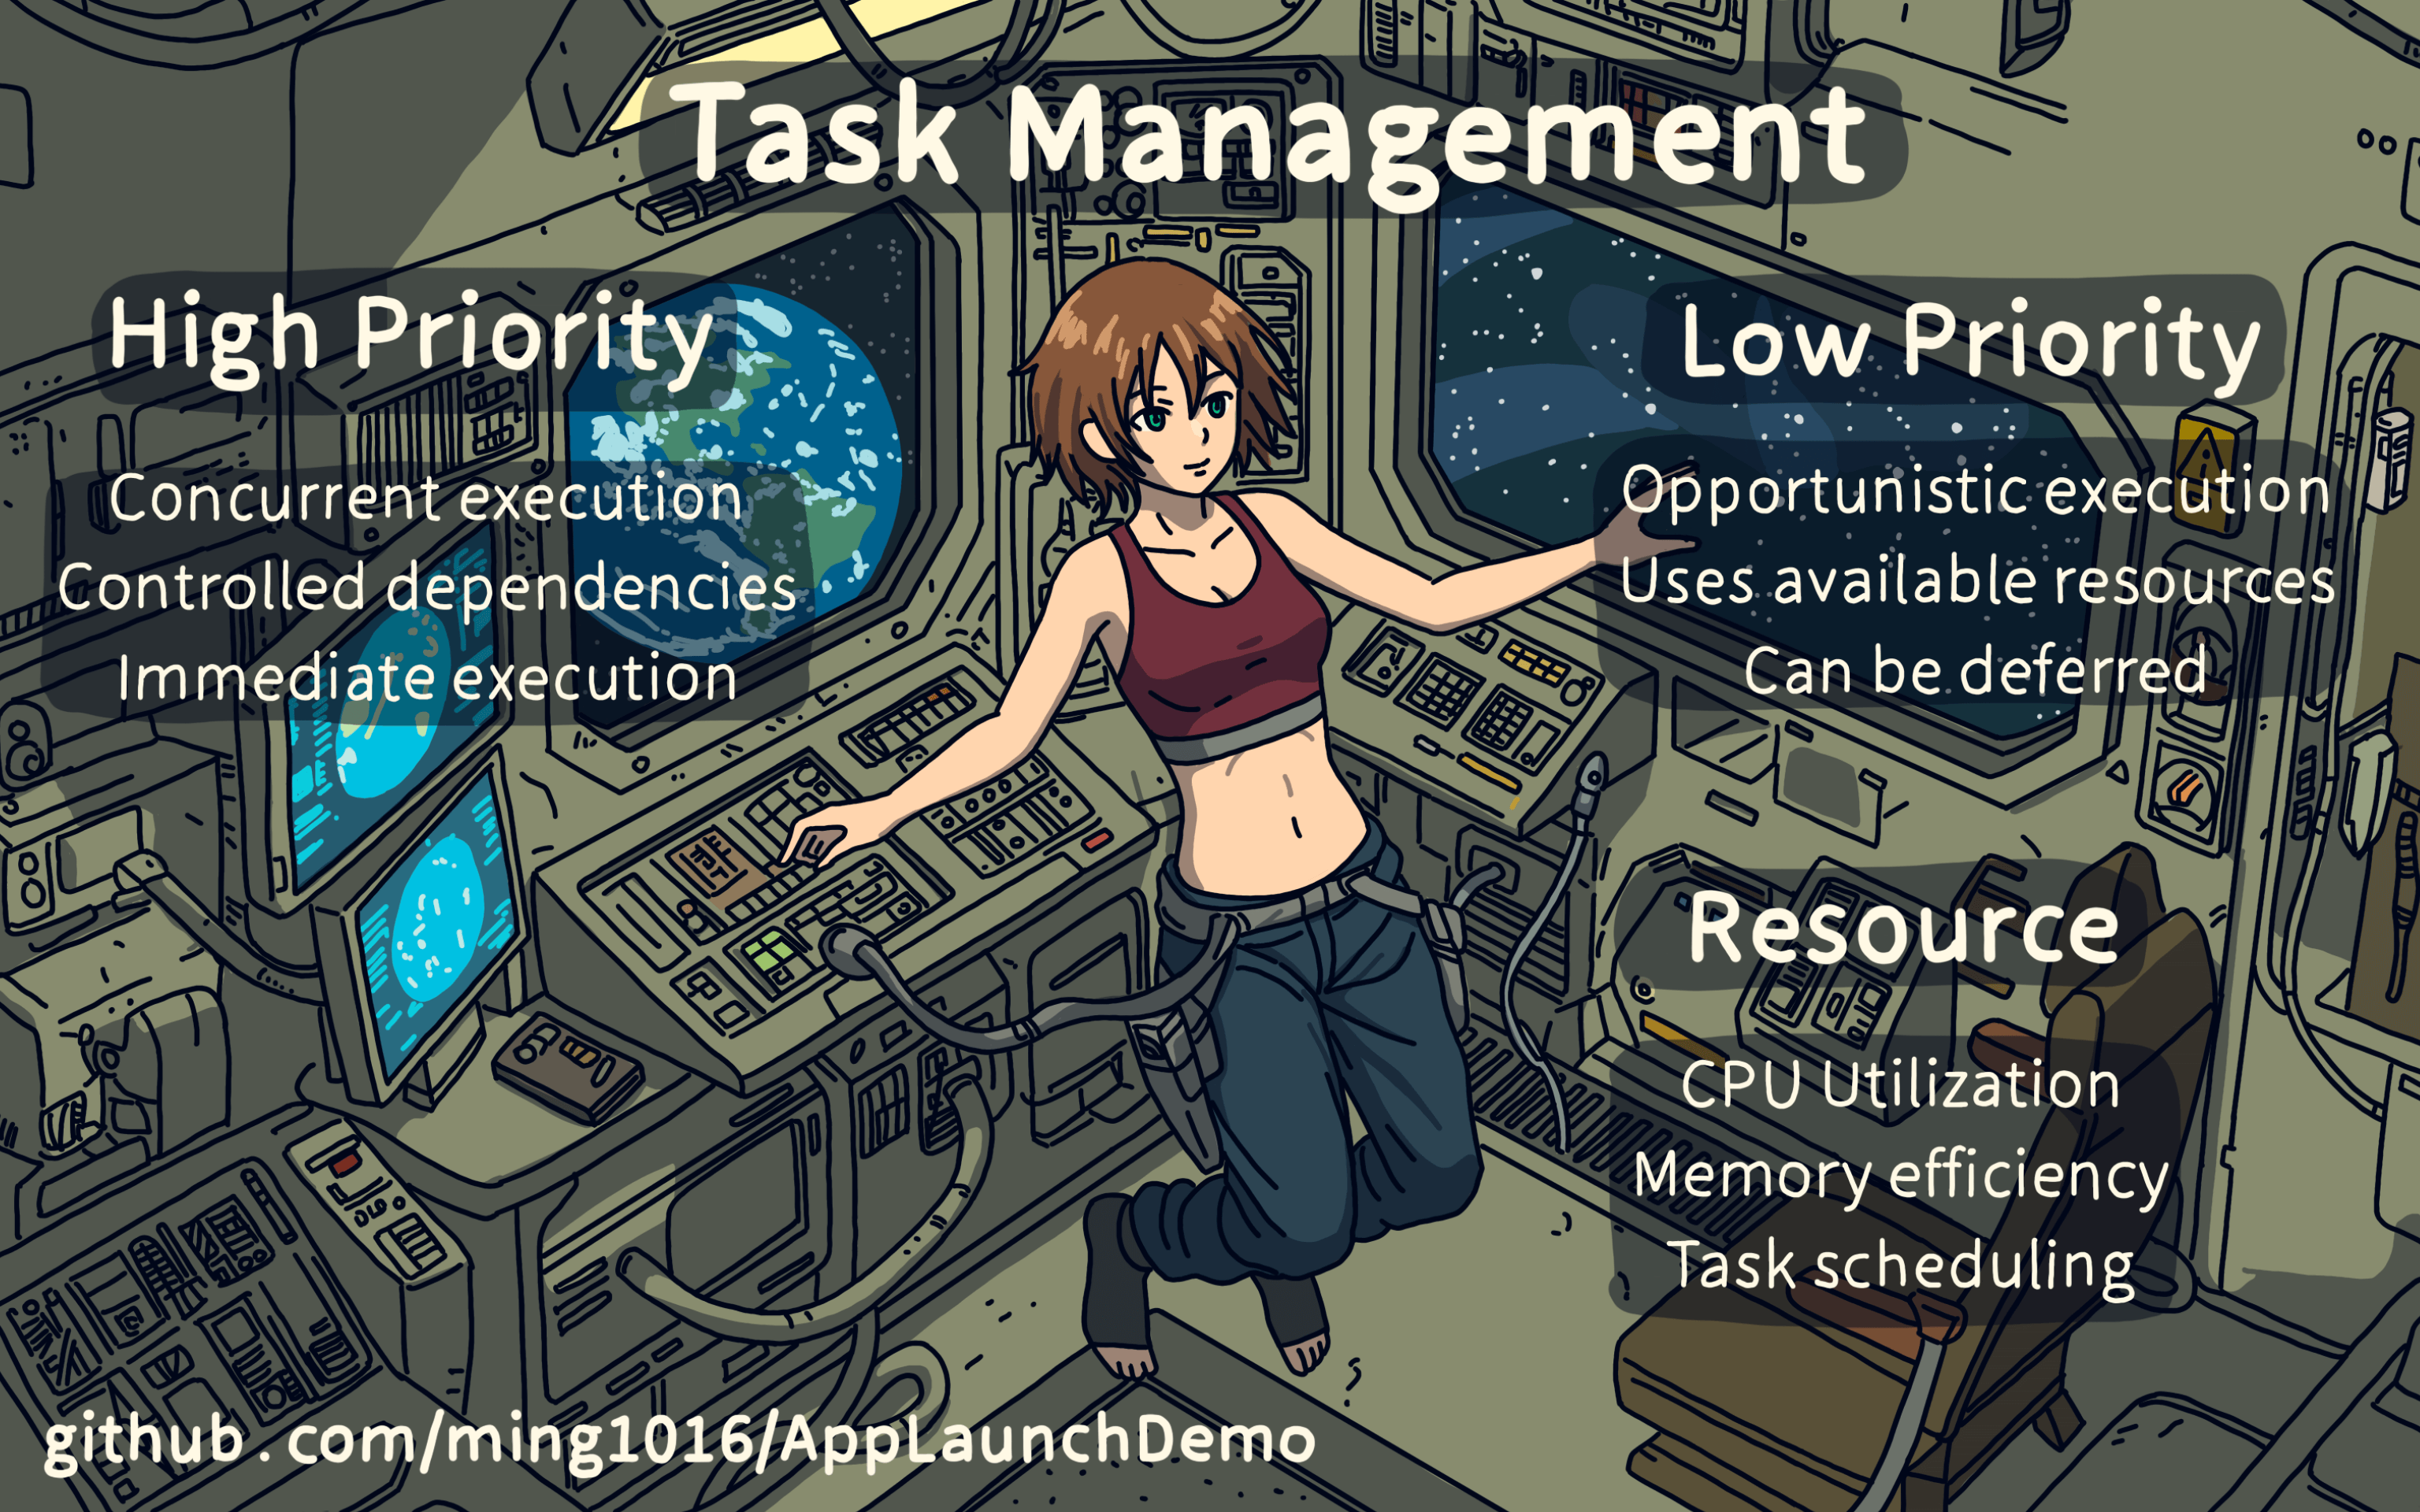
CPU and memory are limited resources.
If we don’t manage multithreading tasks properly, tasks can pile up at times, causing the CPU to switch between threads frequently, which wastes time.
When threads aren’t busy, the CPU isn’t fully utilized, causing delays and slowing down startup time.
The larger the codebase, the more obvious these issues become.
So, how can we better manage multithreading tasks and make full use of the CPU?
We divide tasks into high-priority and low-priority ones. High-priority tasks should run concurrently and can have dependencies managed.
Low-priority tasks can be delayed and run only when system resources are available.
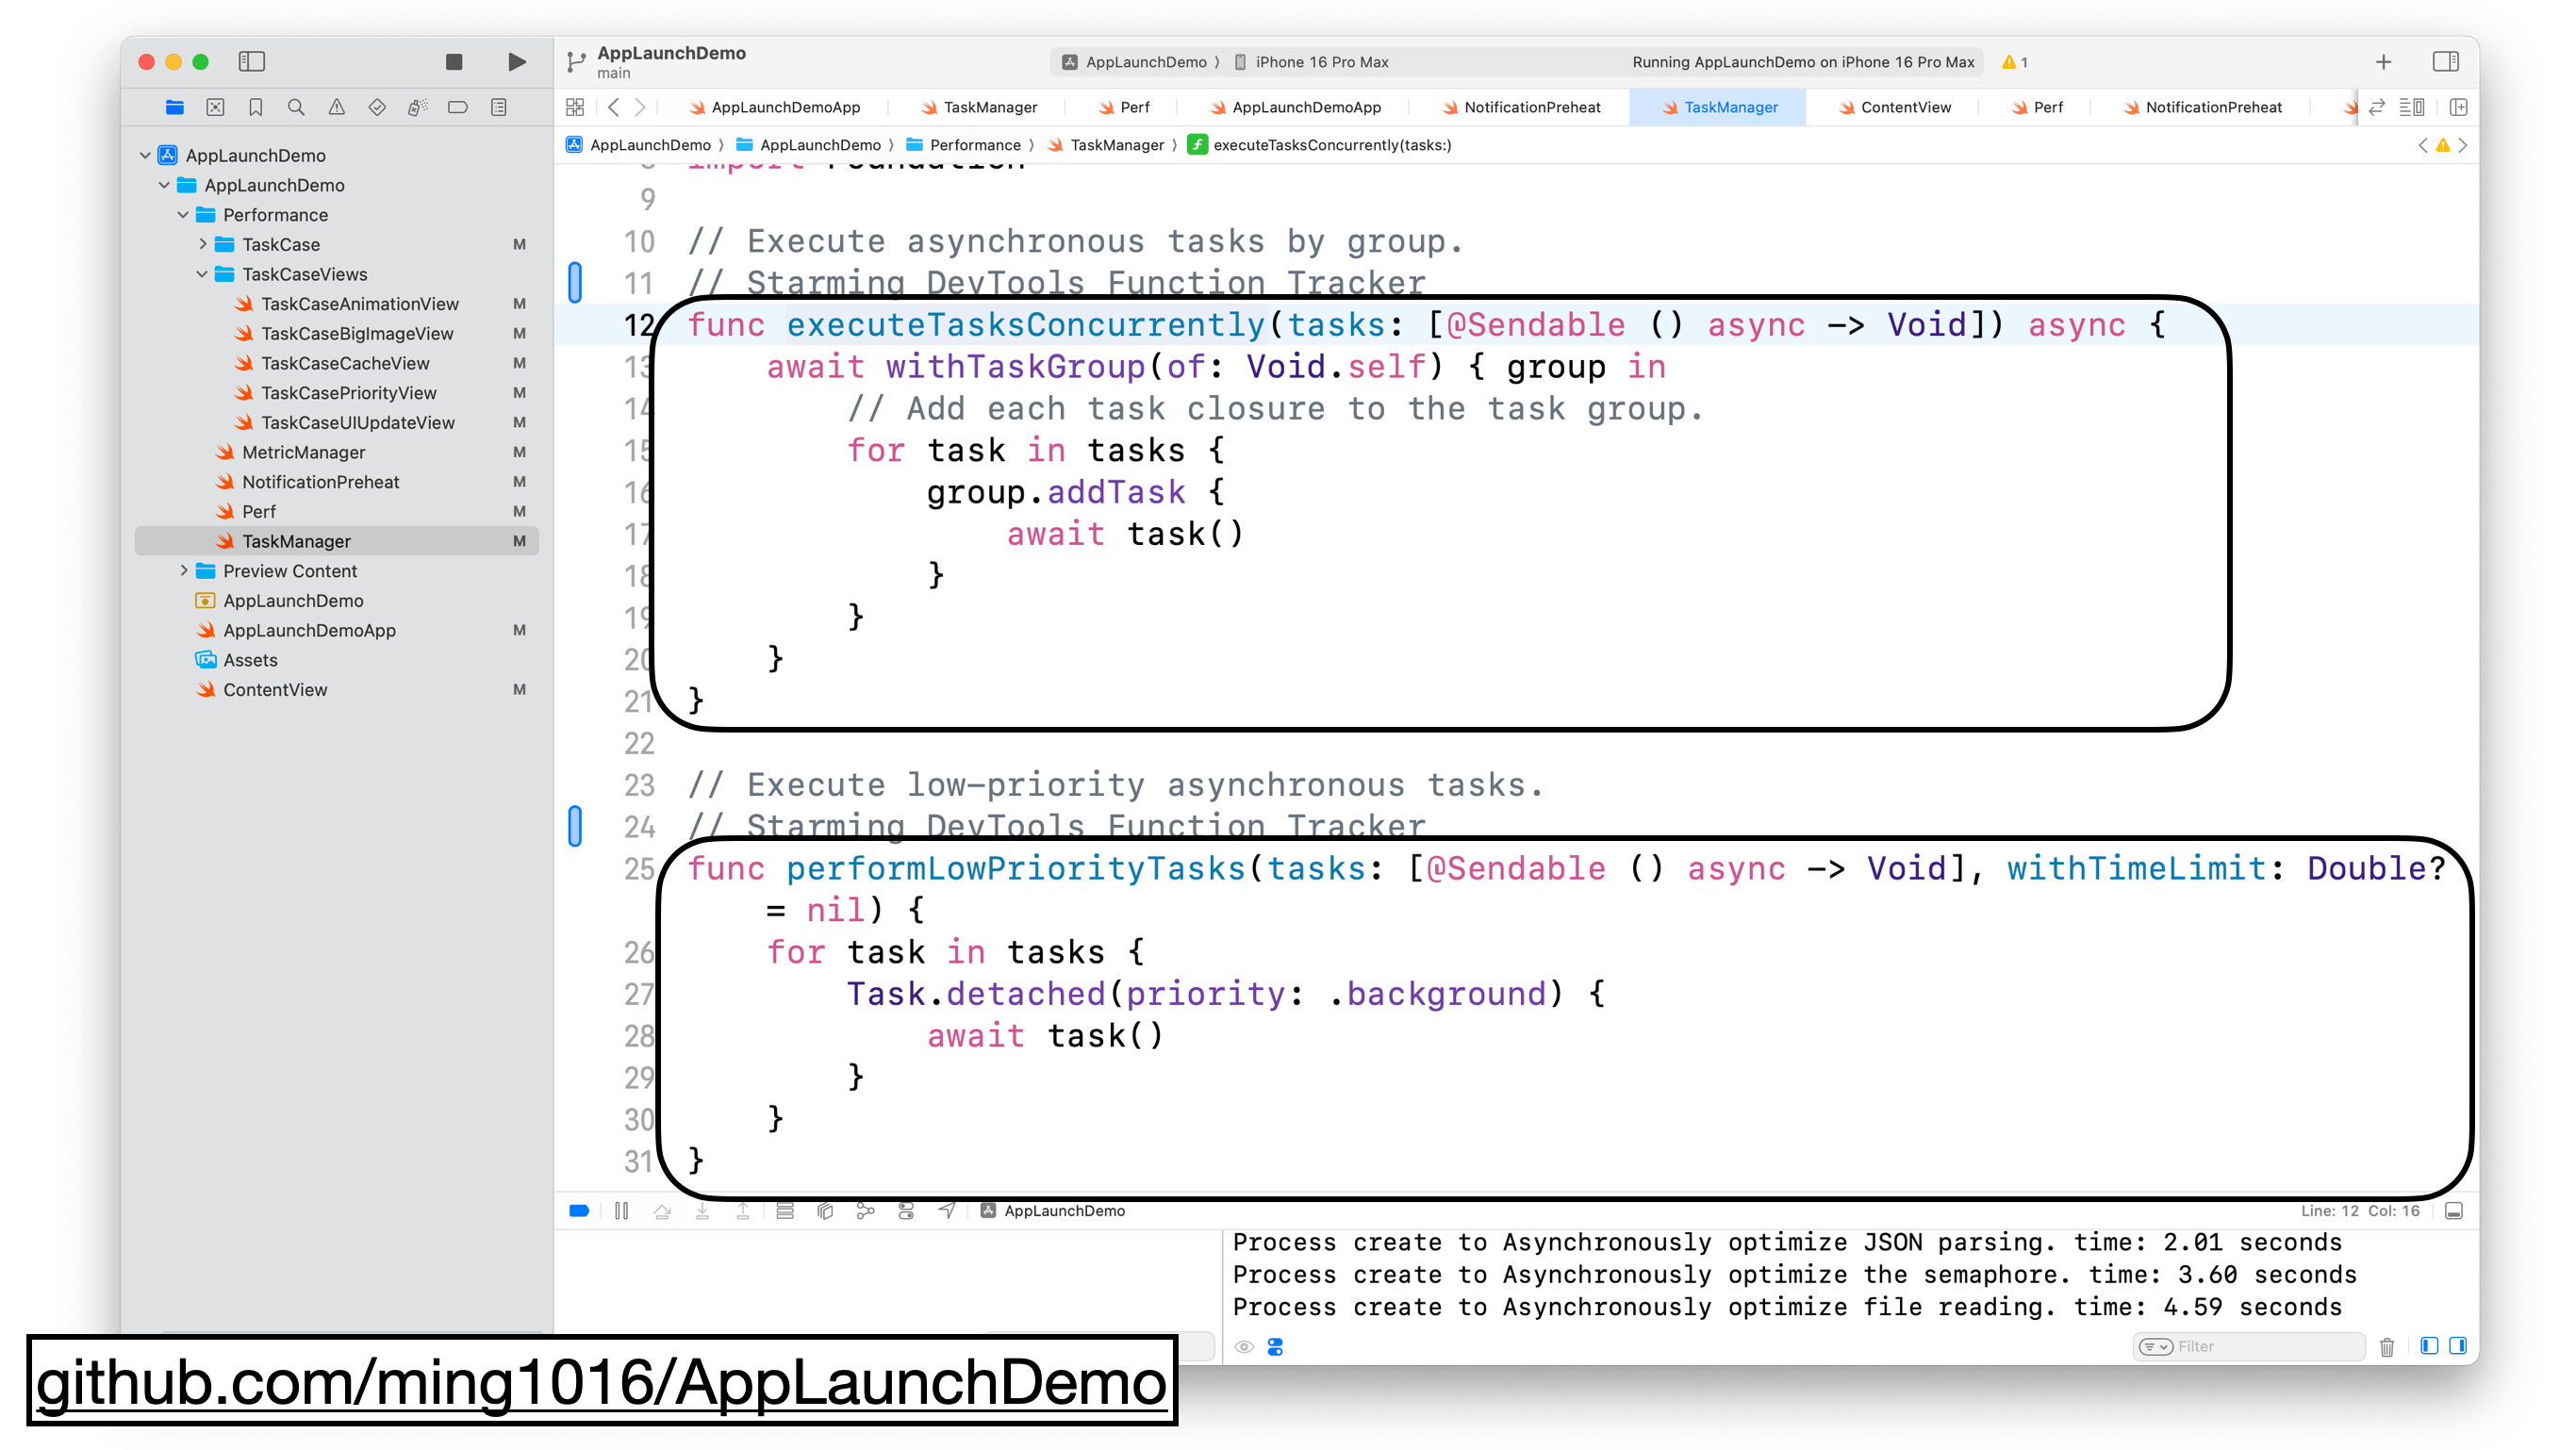
I created two functions: executeTasksConcurrently and performLowPriorityTasks.
executeTasksConcurrently runs high-priority tasks concurrently using Swift Concurrency’s withTaskGroup, and the order of calling this function controls task dependencies.
performLowPriorityTasks runs low-priority tasks using Task.detached and sets the task’s priority to background.
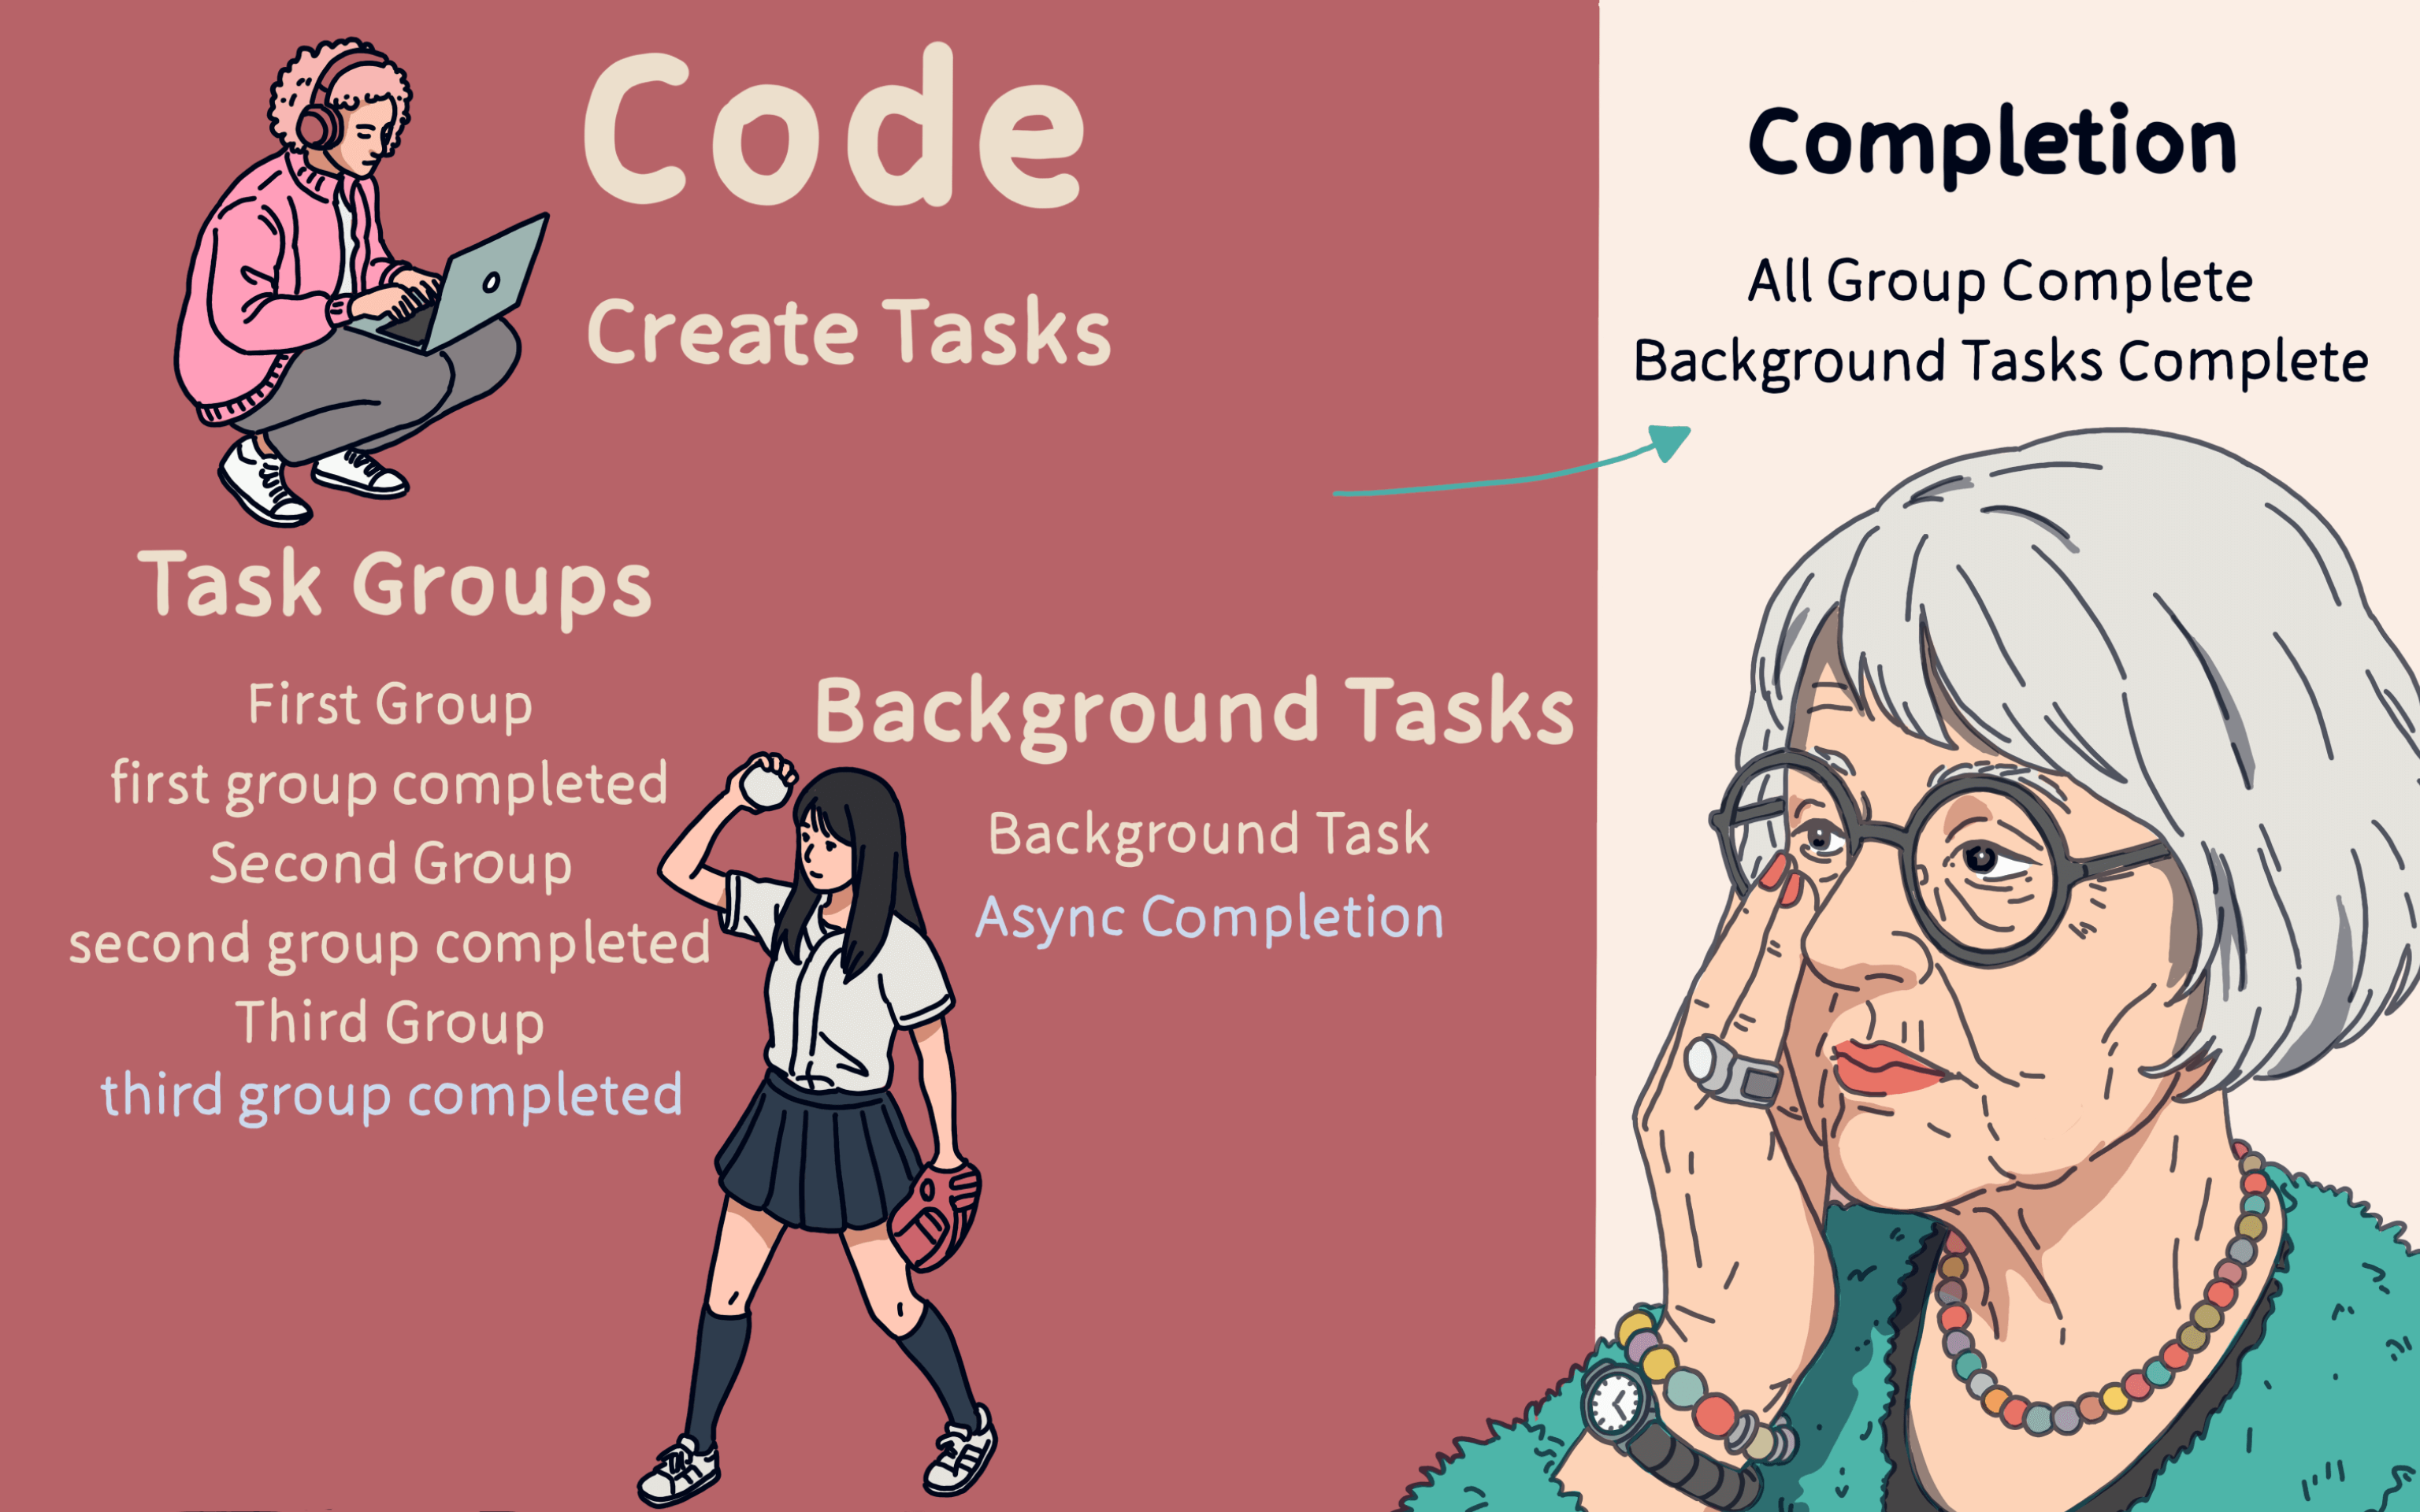
Once we create three high-priority task groups, they will execute sequentially, and tasks within each group will run concurrently. Low-priority tasks will run when system resources are free.
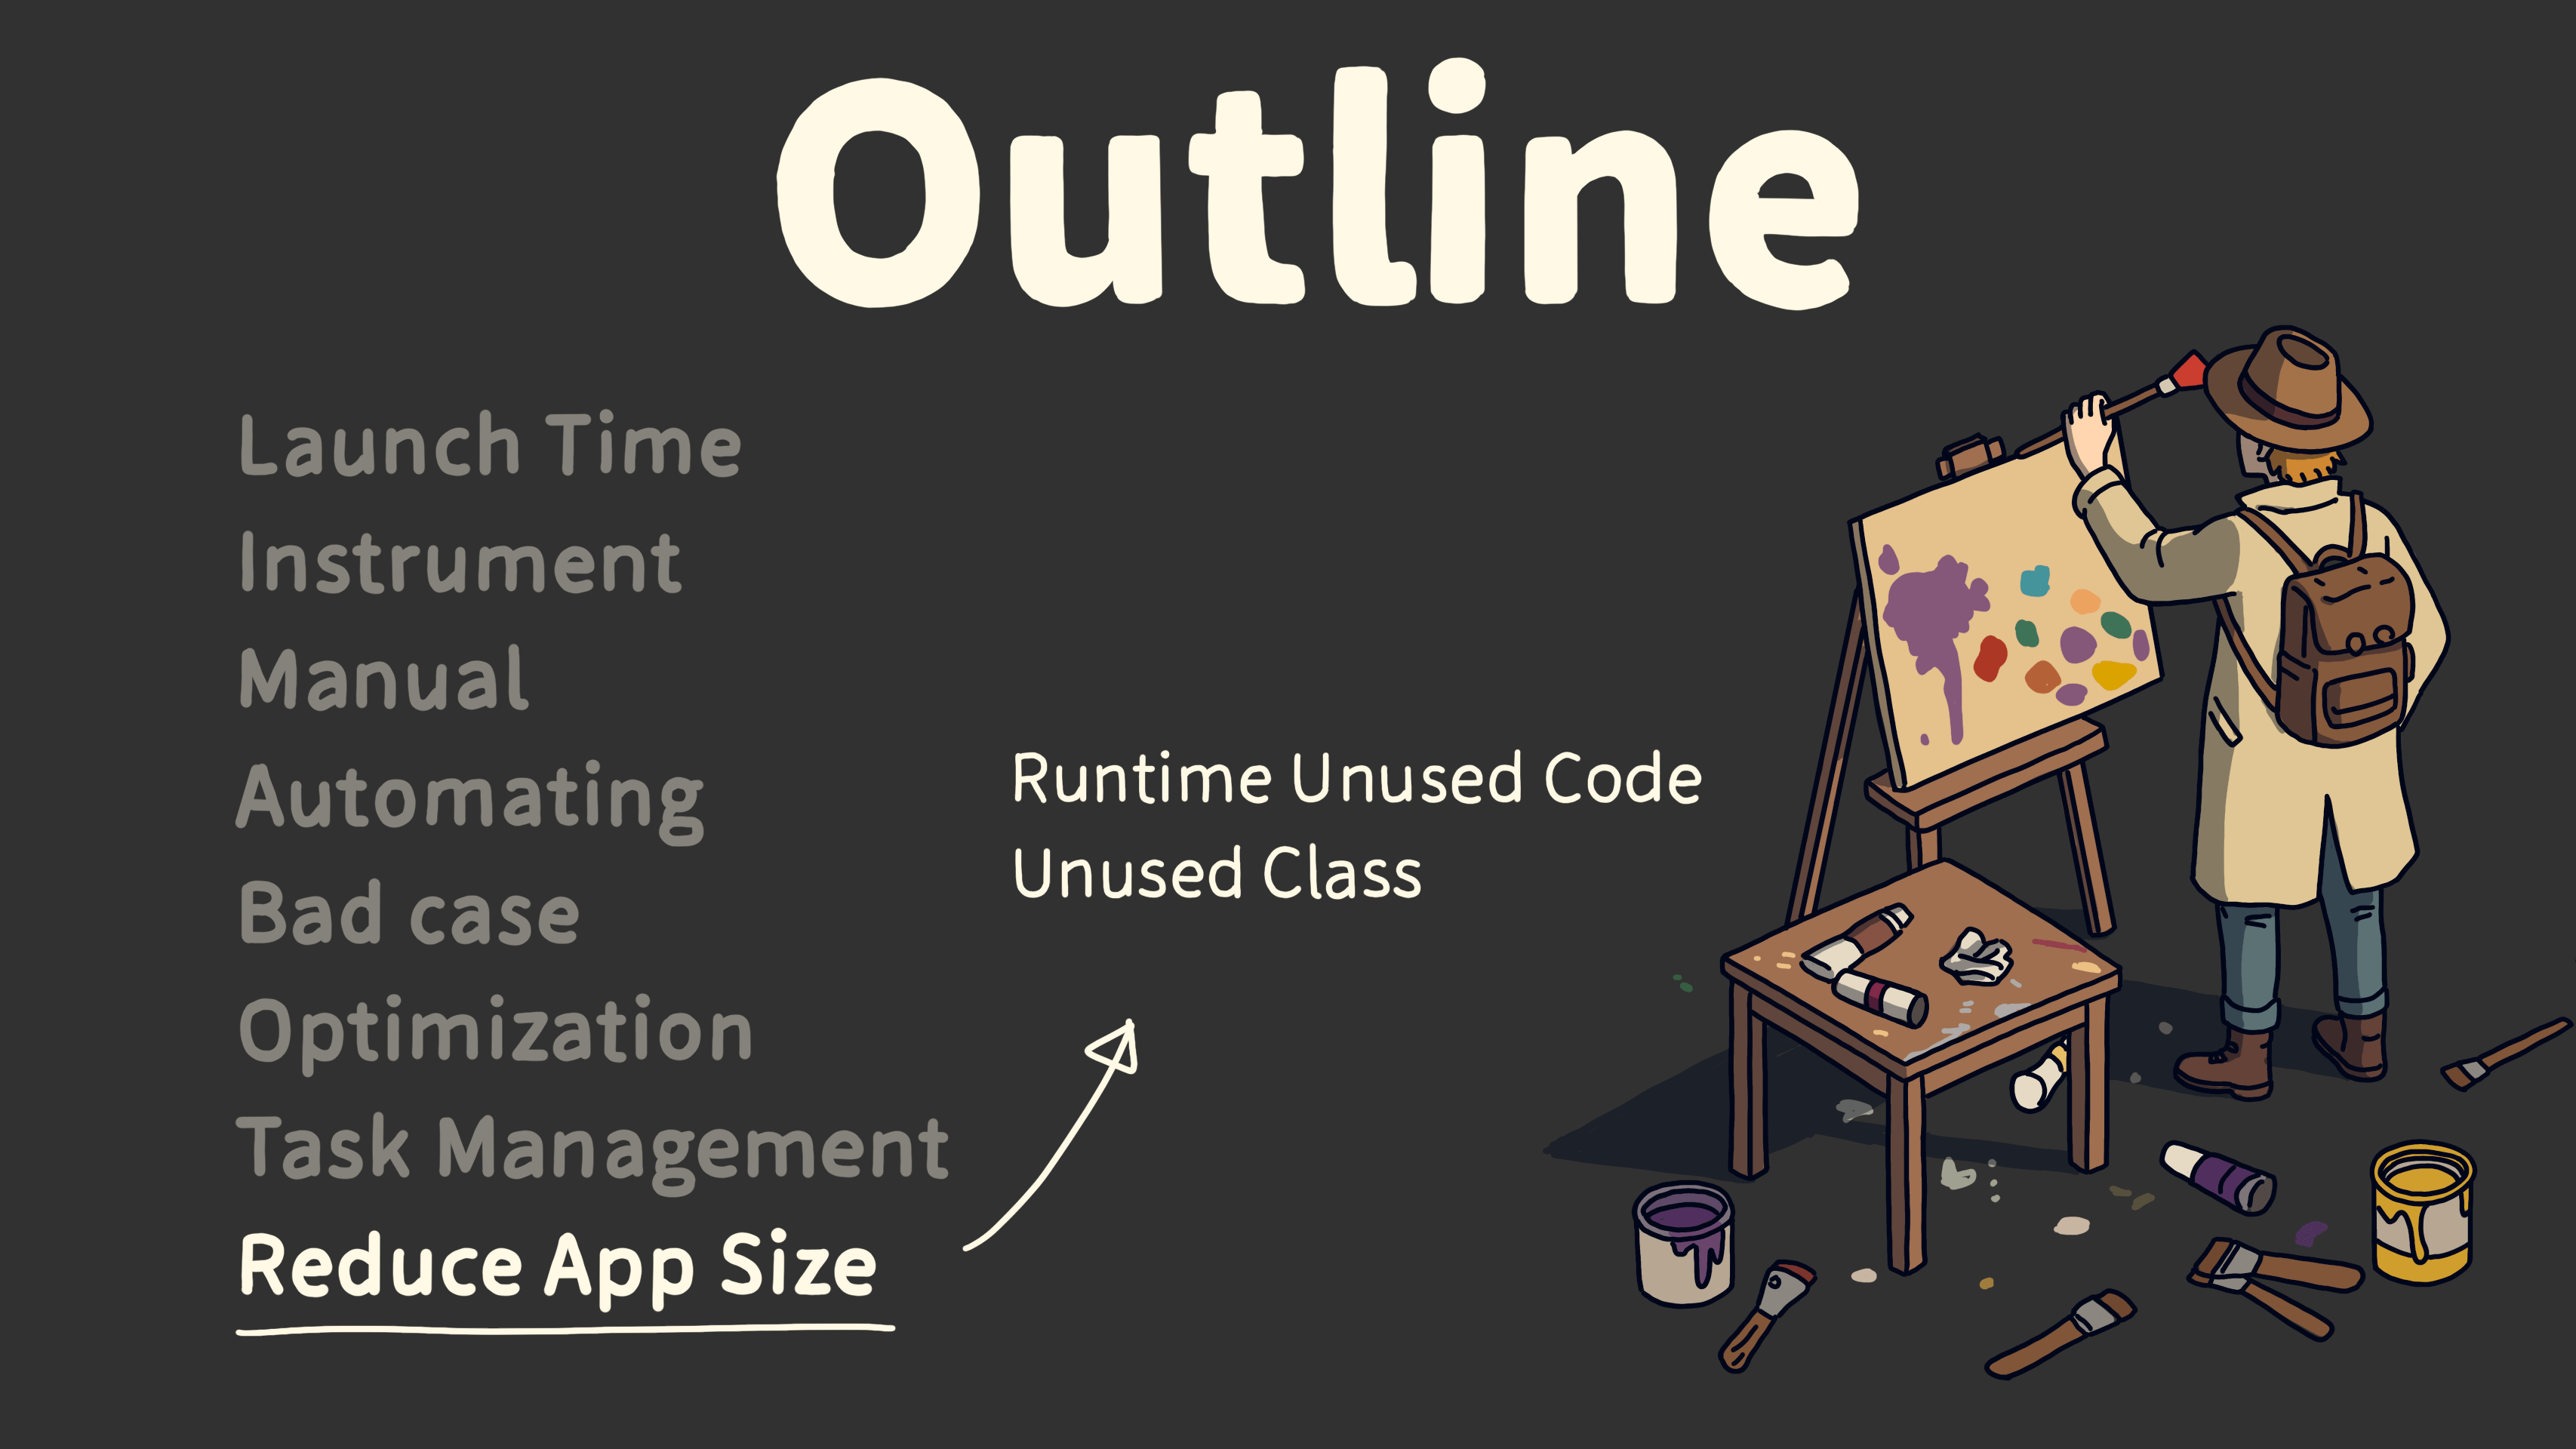
So far, we’ve mostly covered Post-main optimizations. For Pre-main, we can optimize startup time by reducing the app size.
There are many ways to reduce app size, mainly through static analysis. Today, I’ll share how we can analyze at runtime to find unused code, expanding the scope of our optimizations.
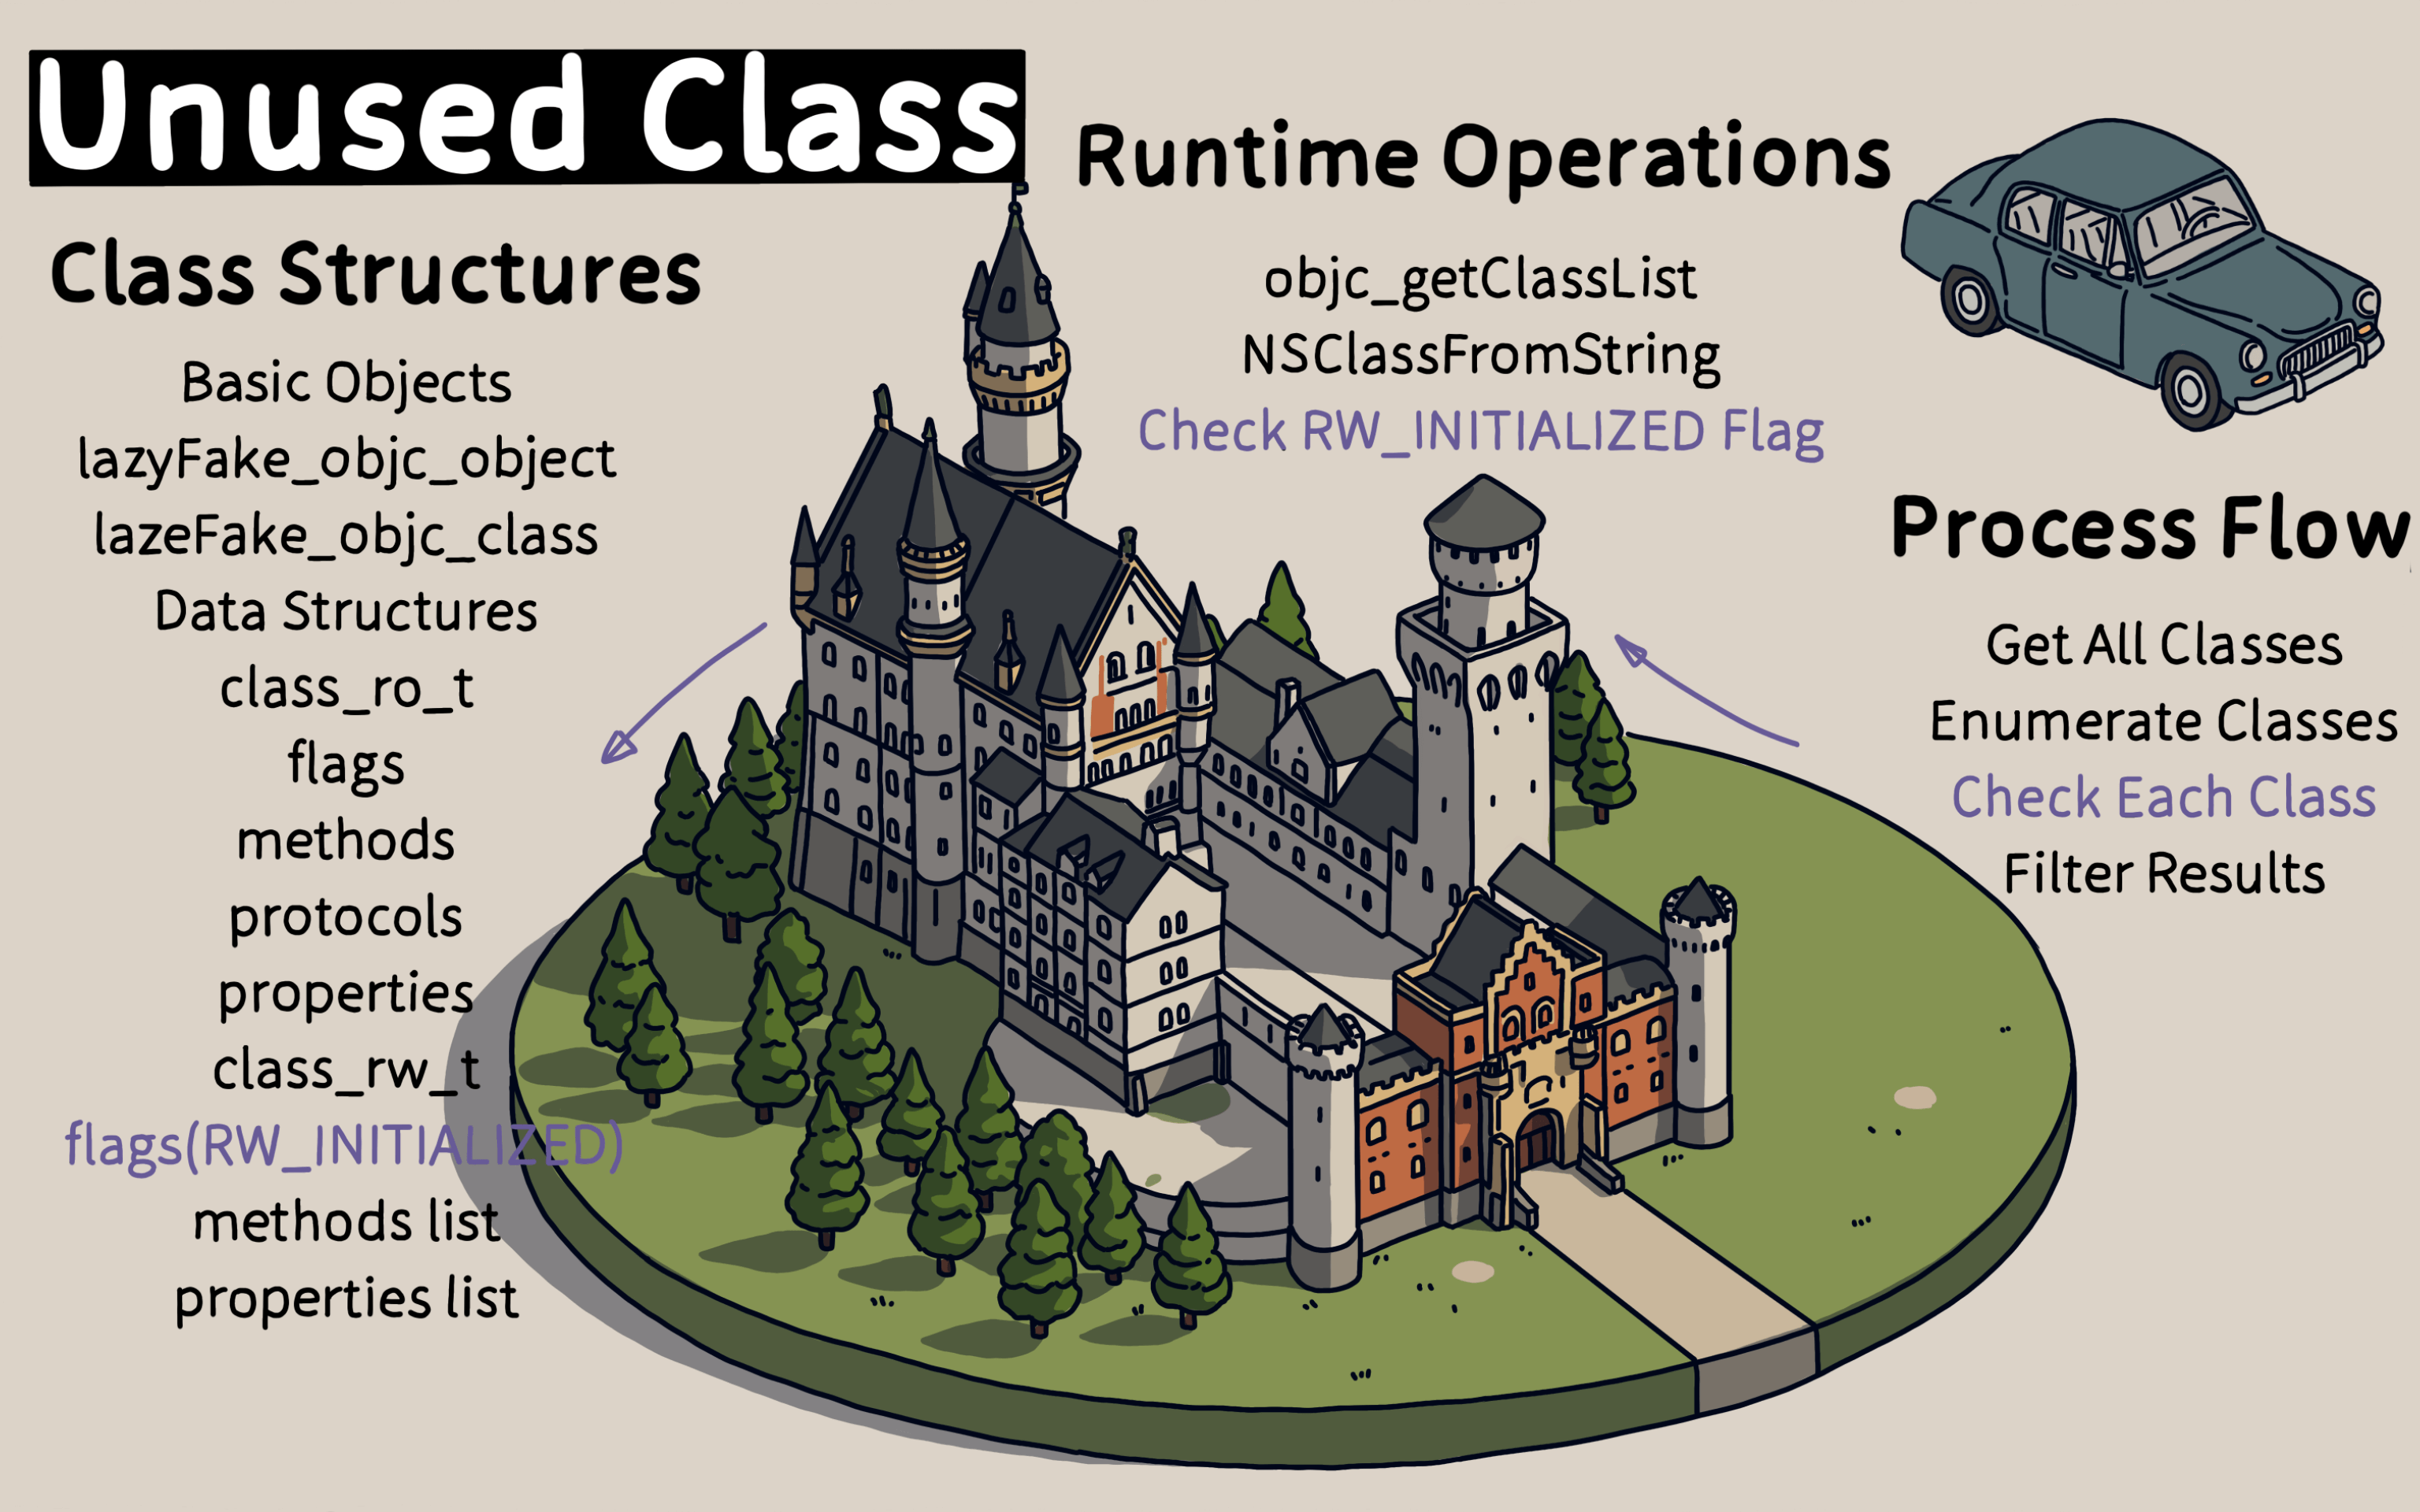
Let me introduce a solution that can help identify which classes are not being used during runtime.
The process involves checking all classes when the app goes to the background and determining which ones have been initialized.
We use the objc_getClassList API to get a list of all classes, and NSClassFromString to find the metaclass of each class. The metaclass’s flag field, when shifted 29 bits, tells us if the class was initialized during runtime.
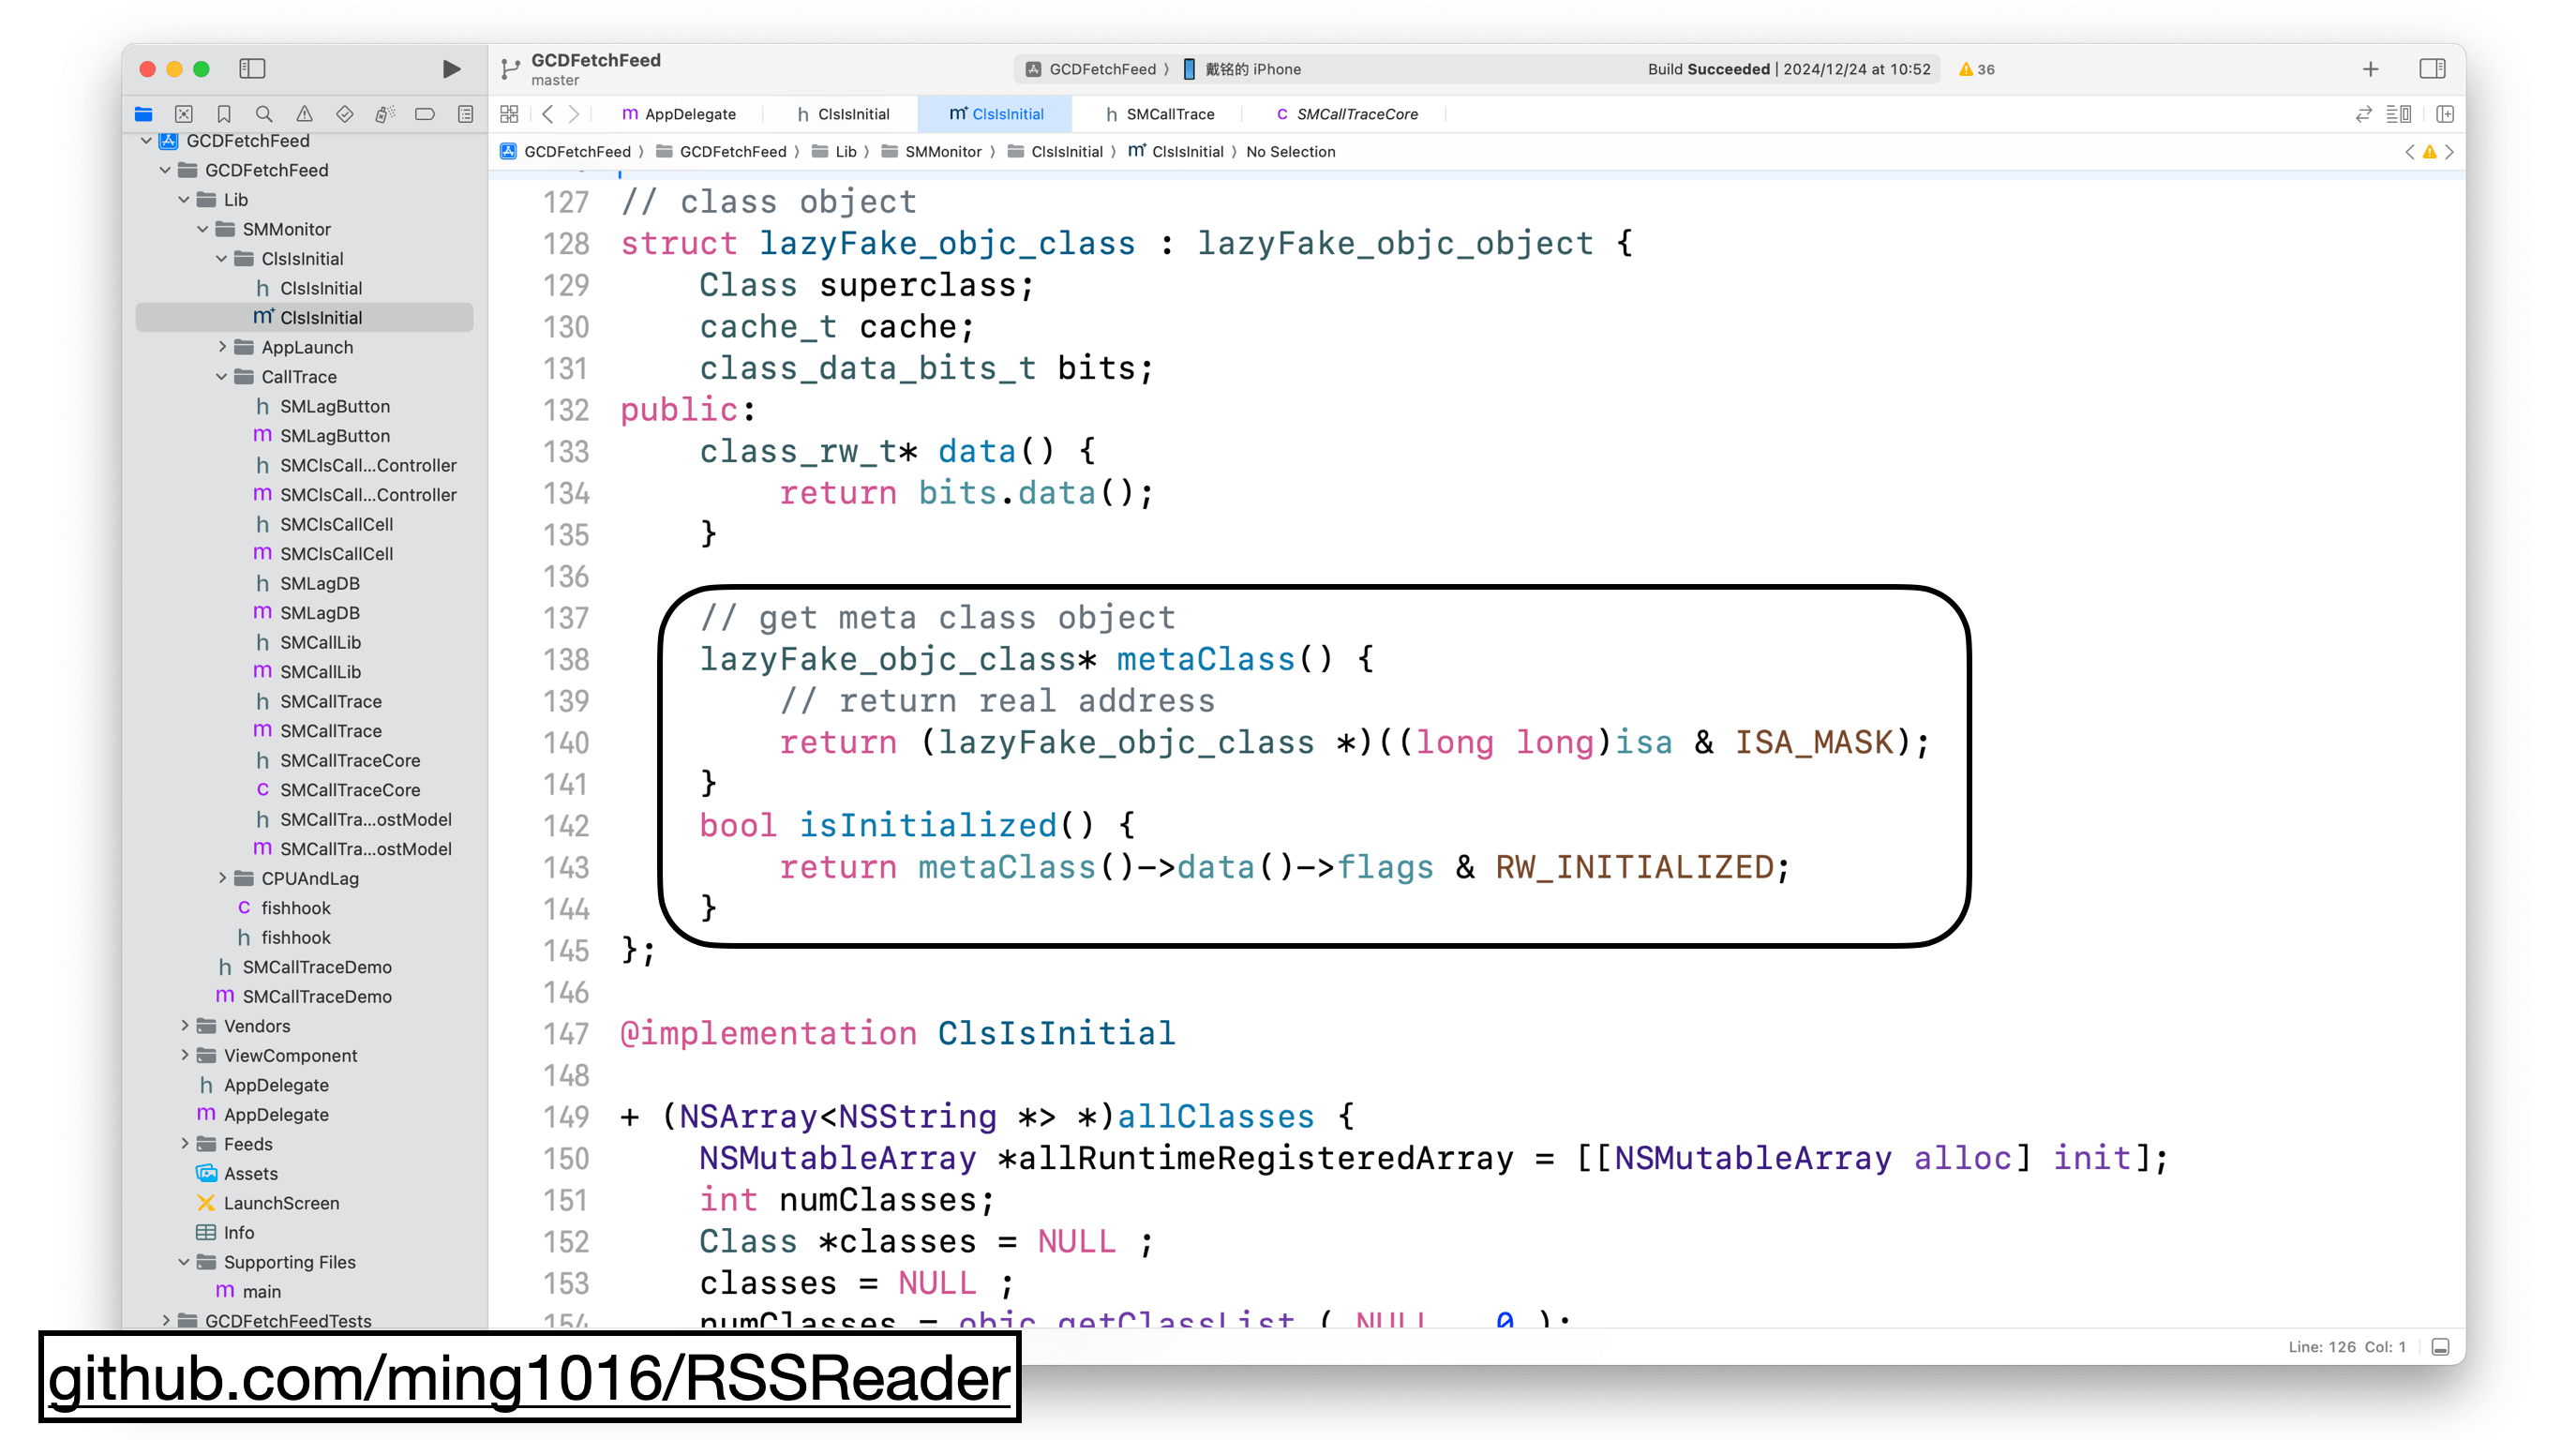
In the code, the metaClass struct’s data method returns a class_rw_t metaclass struct. The flag field is shifted left by 29 bits. A value of 0 means the class hasn’t been initialized, while 1 means it has.
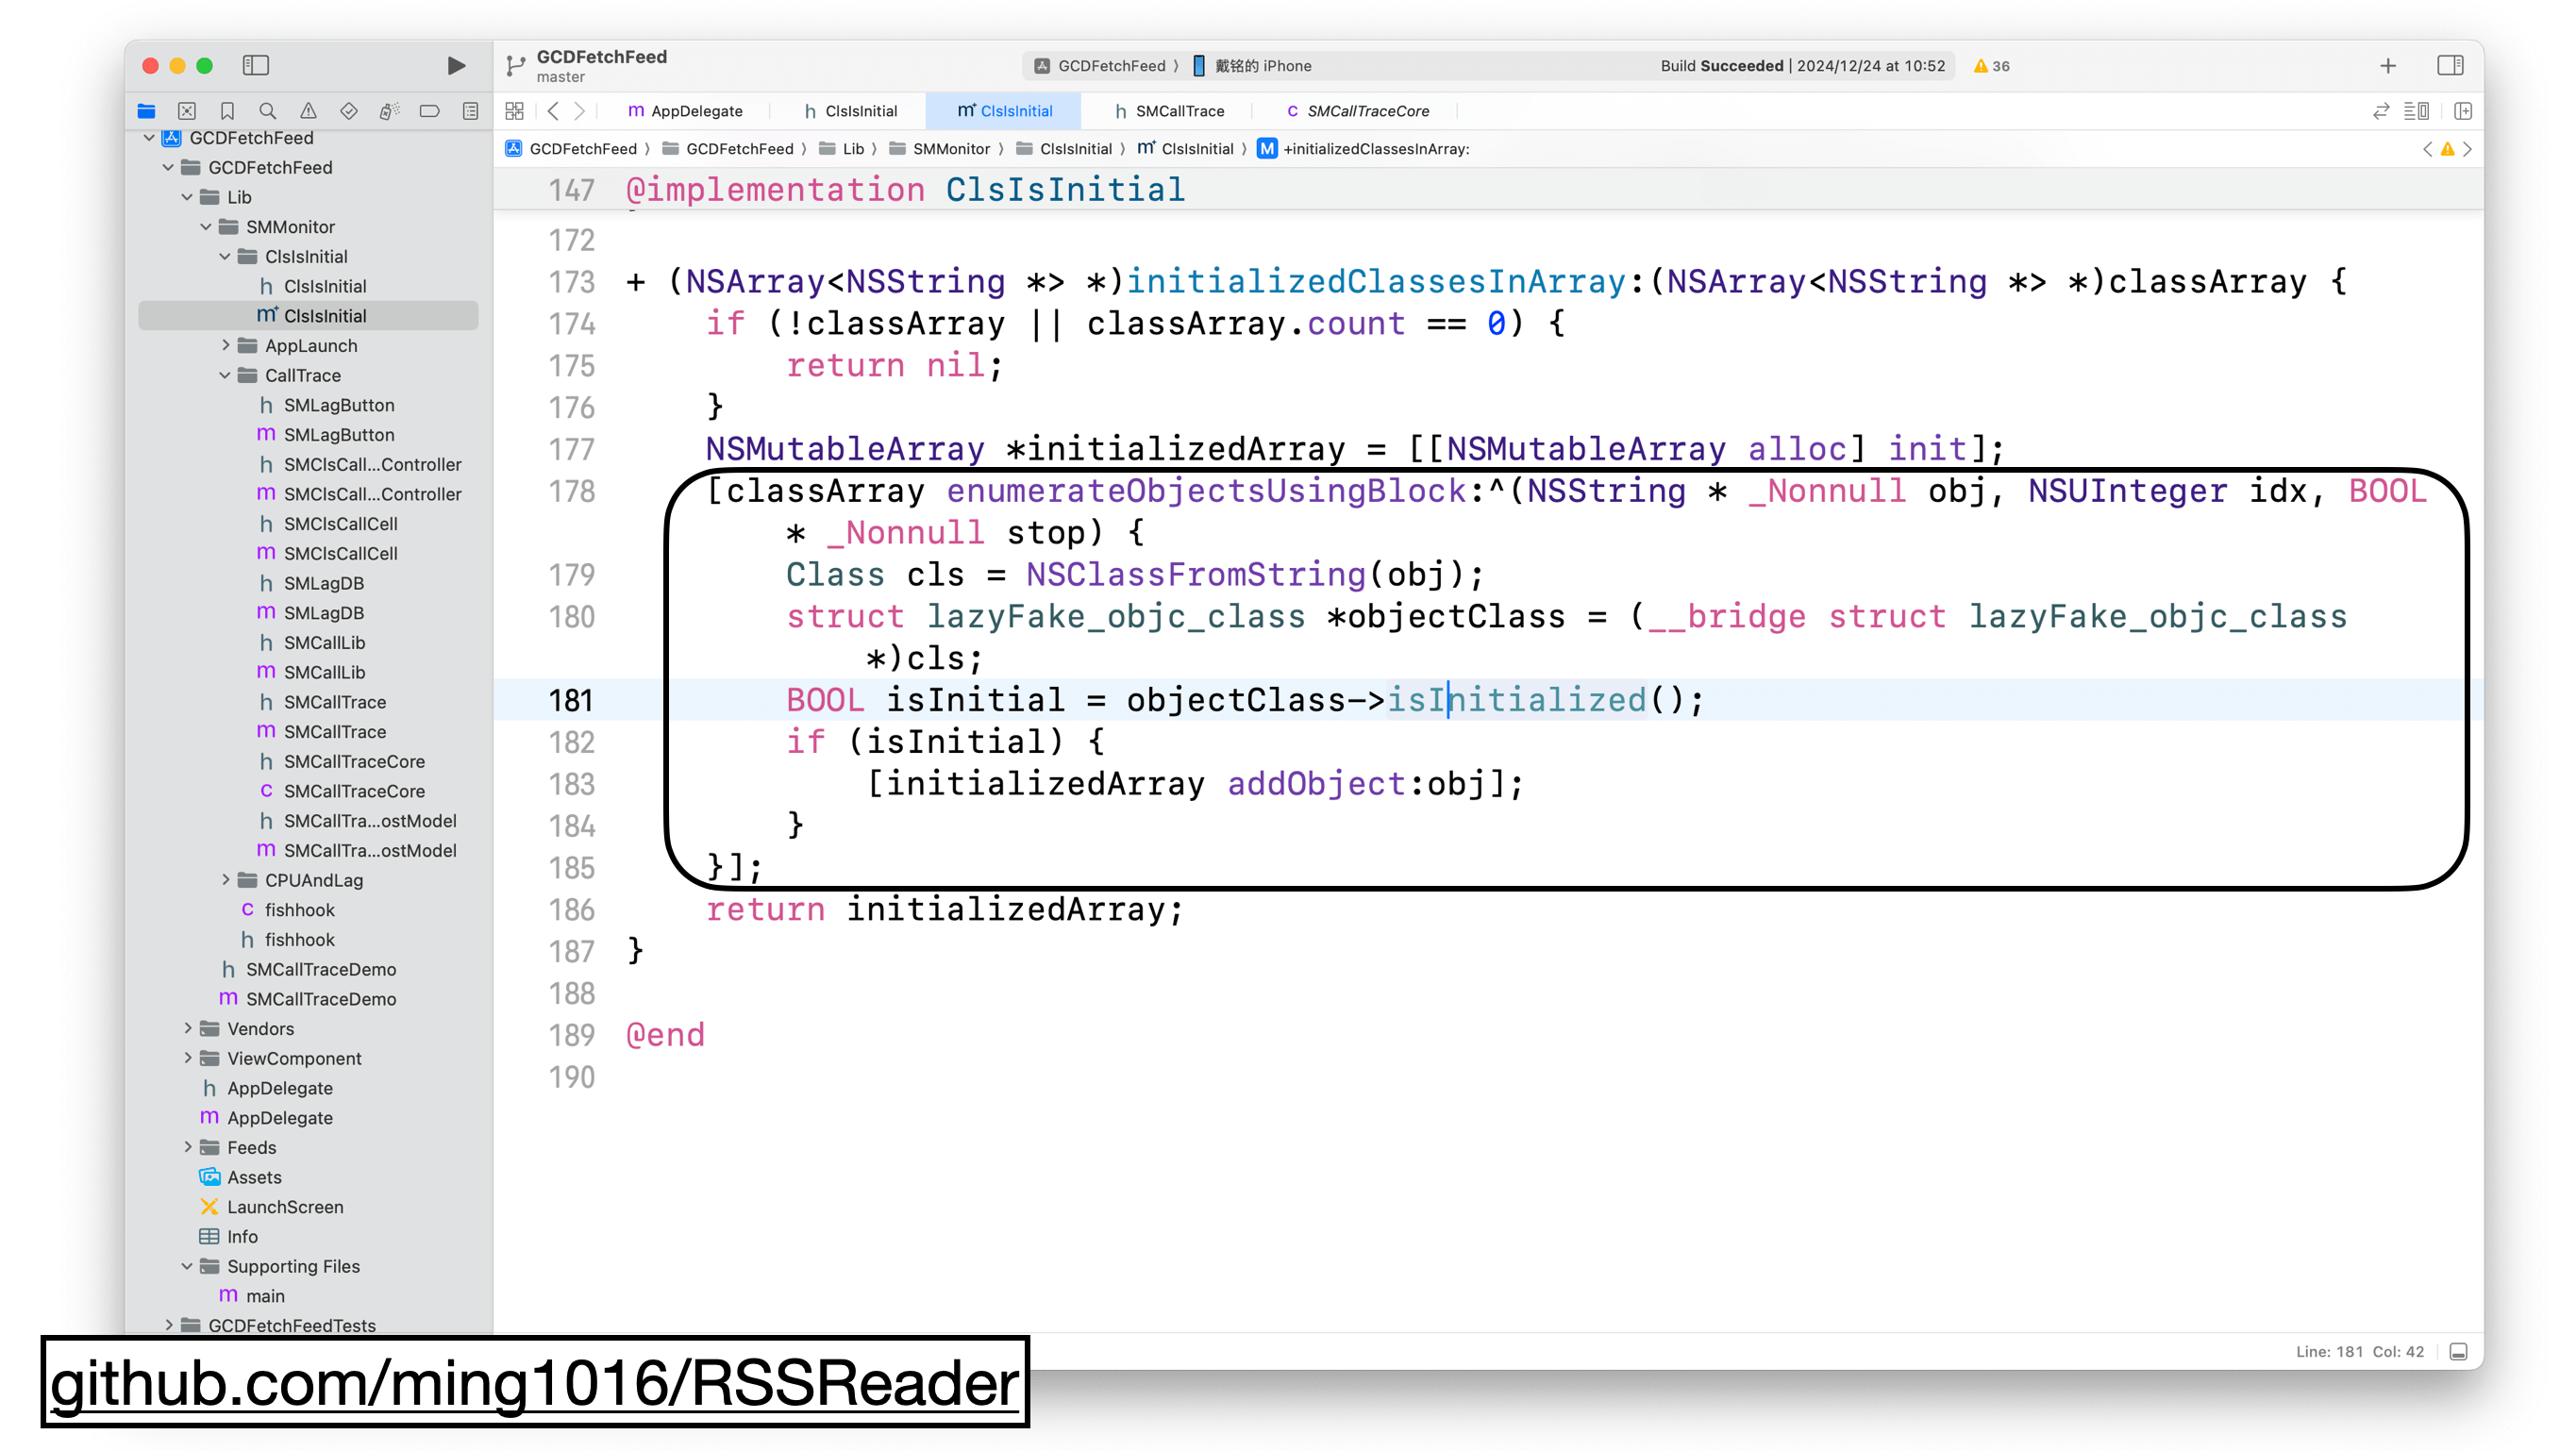
In the initializedClassesInArray method, we use NSClassFromString to get class data, then call isInitialized to check if the class was initialized. We add initialized classes to an array, and the remaining classes are the ones not used during this app session.
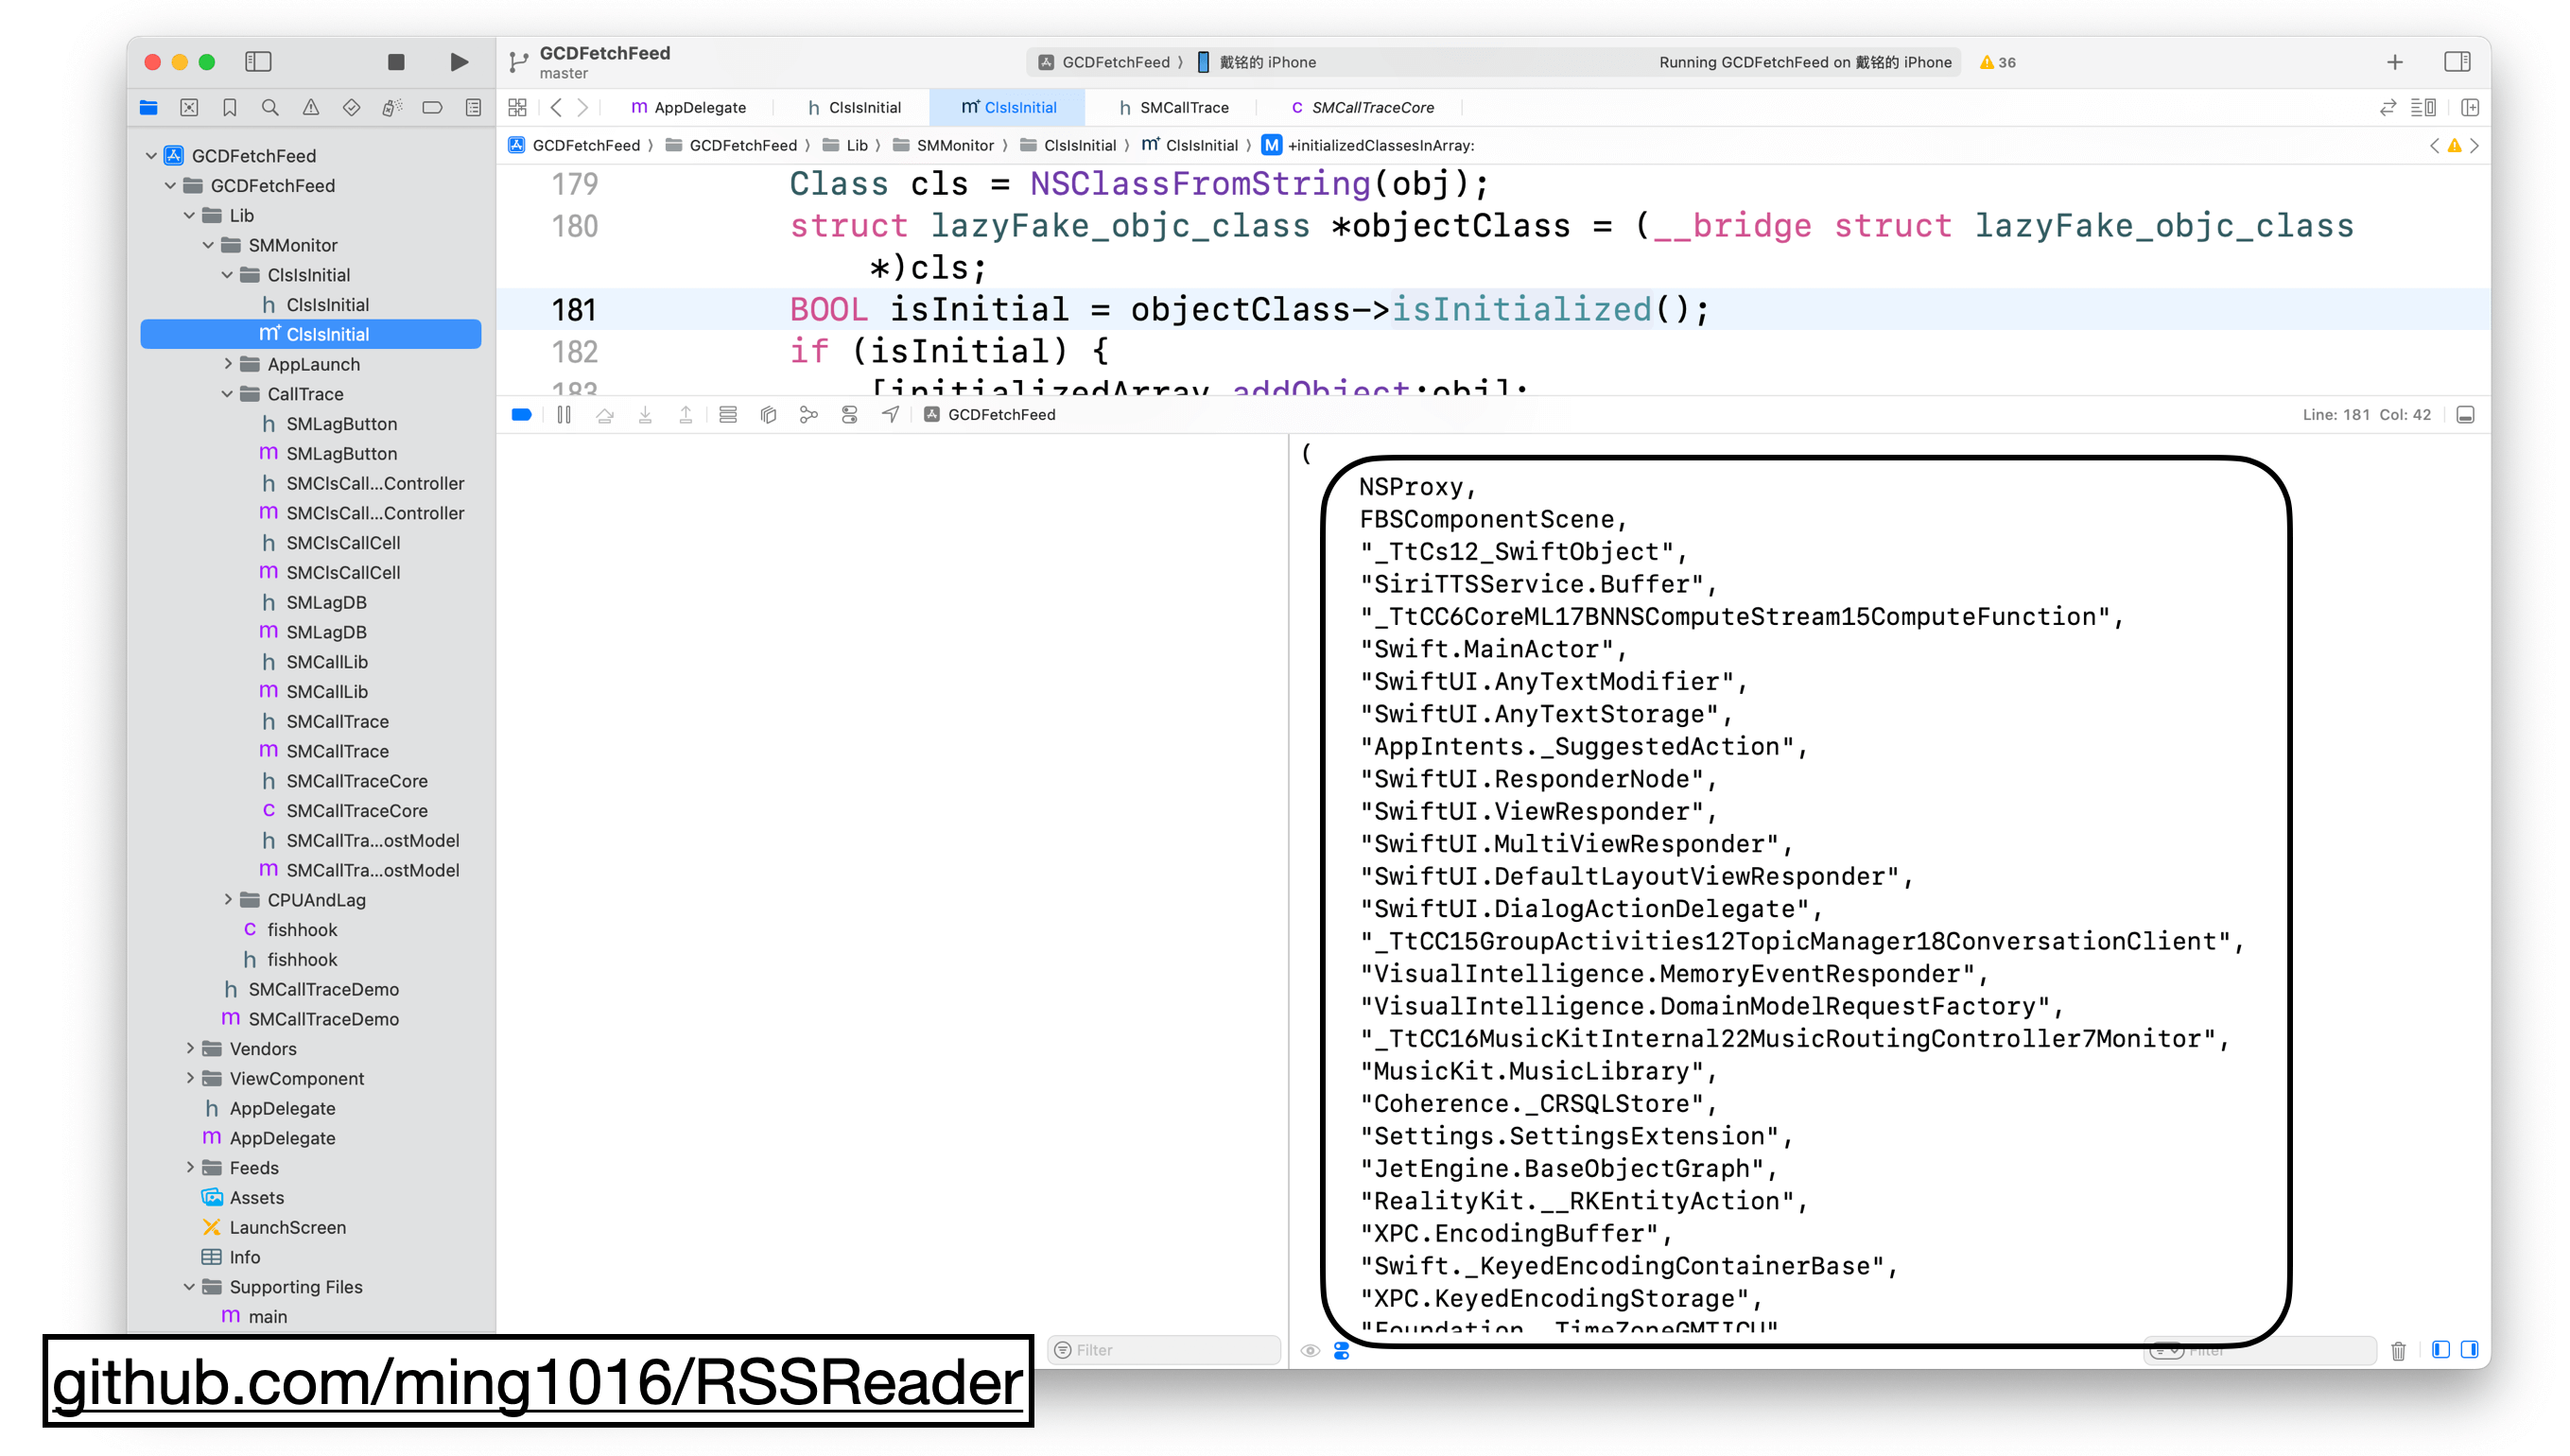
Here, I’ve printed out all the initialized classes.
It’s also how we check for unused code in our company.
From the results of the analysis, this solution indeed detects a lot of unused code, especially older code.
However, there’s one issue. If a class contains many functions, as long as one of them is used, the entire class is considered “in use.”
So, we need to take it a step further and find even more unused code.
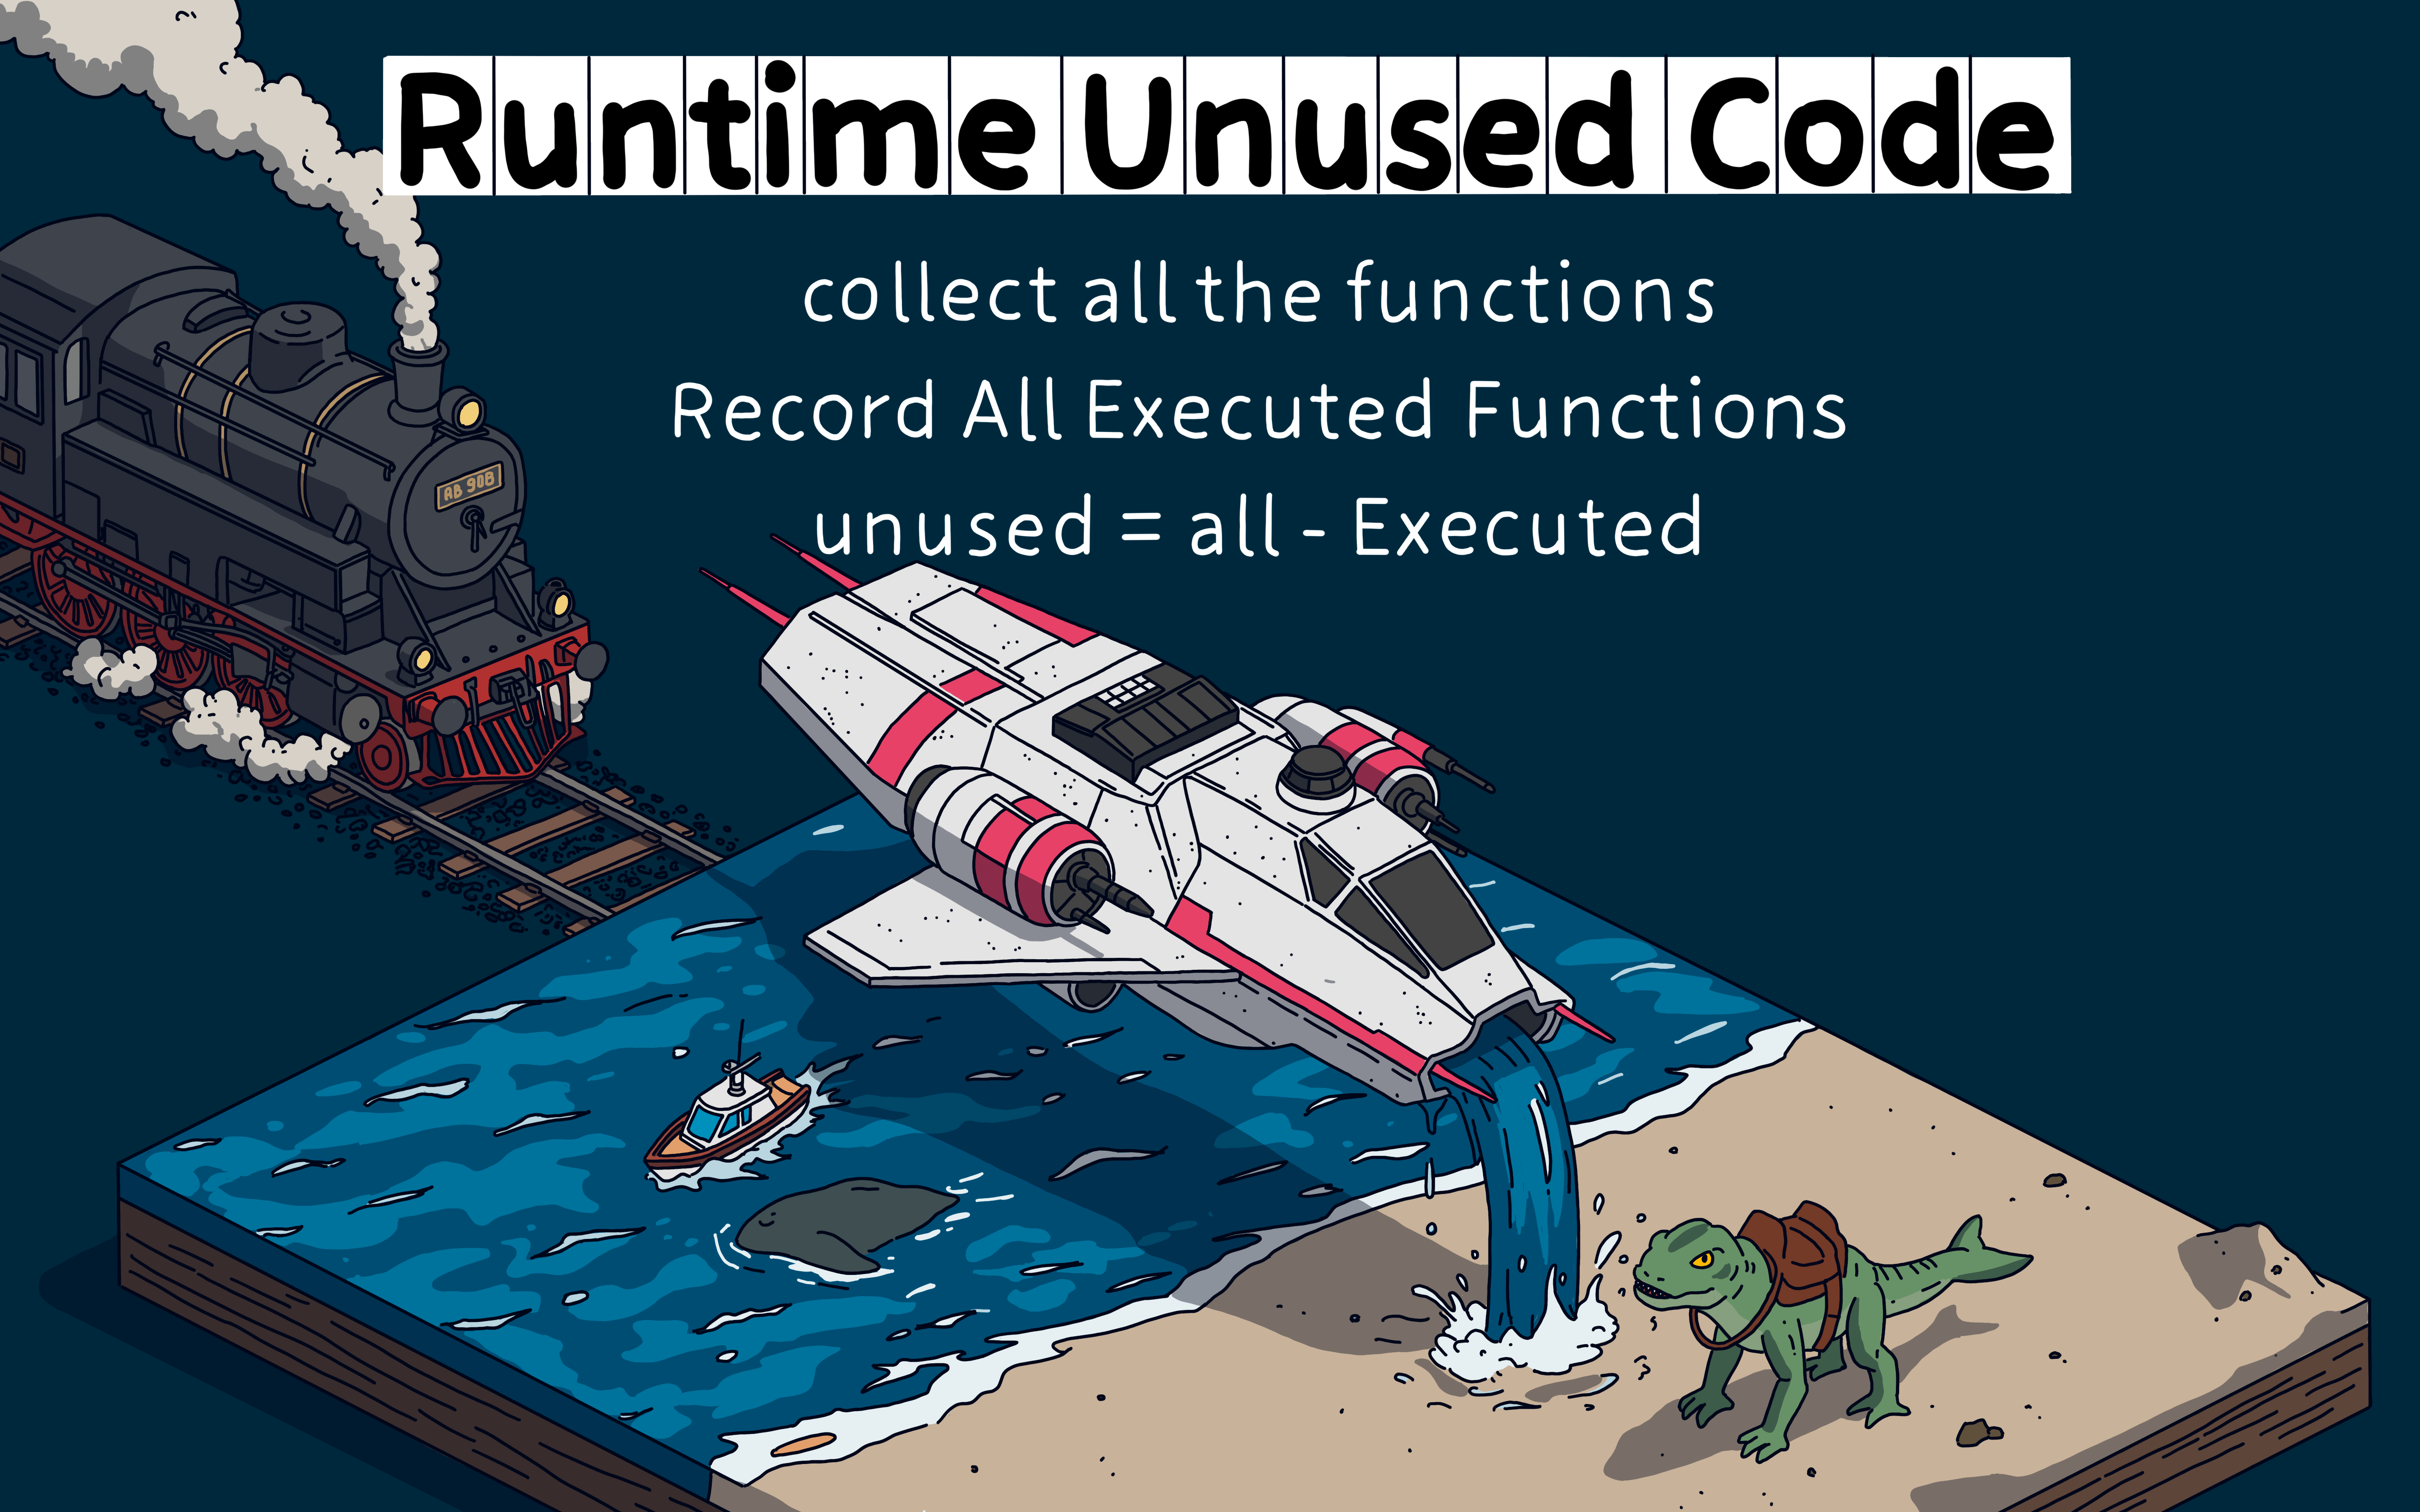
Do you remember the tool I created to collect Swift function data?
That tool can also collect data on all the functions in your app.
Every function your app calls during execution gets logged.
By subtracting the functions that are actually called from the total list, we can identify unused functions.
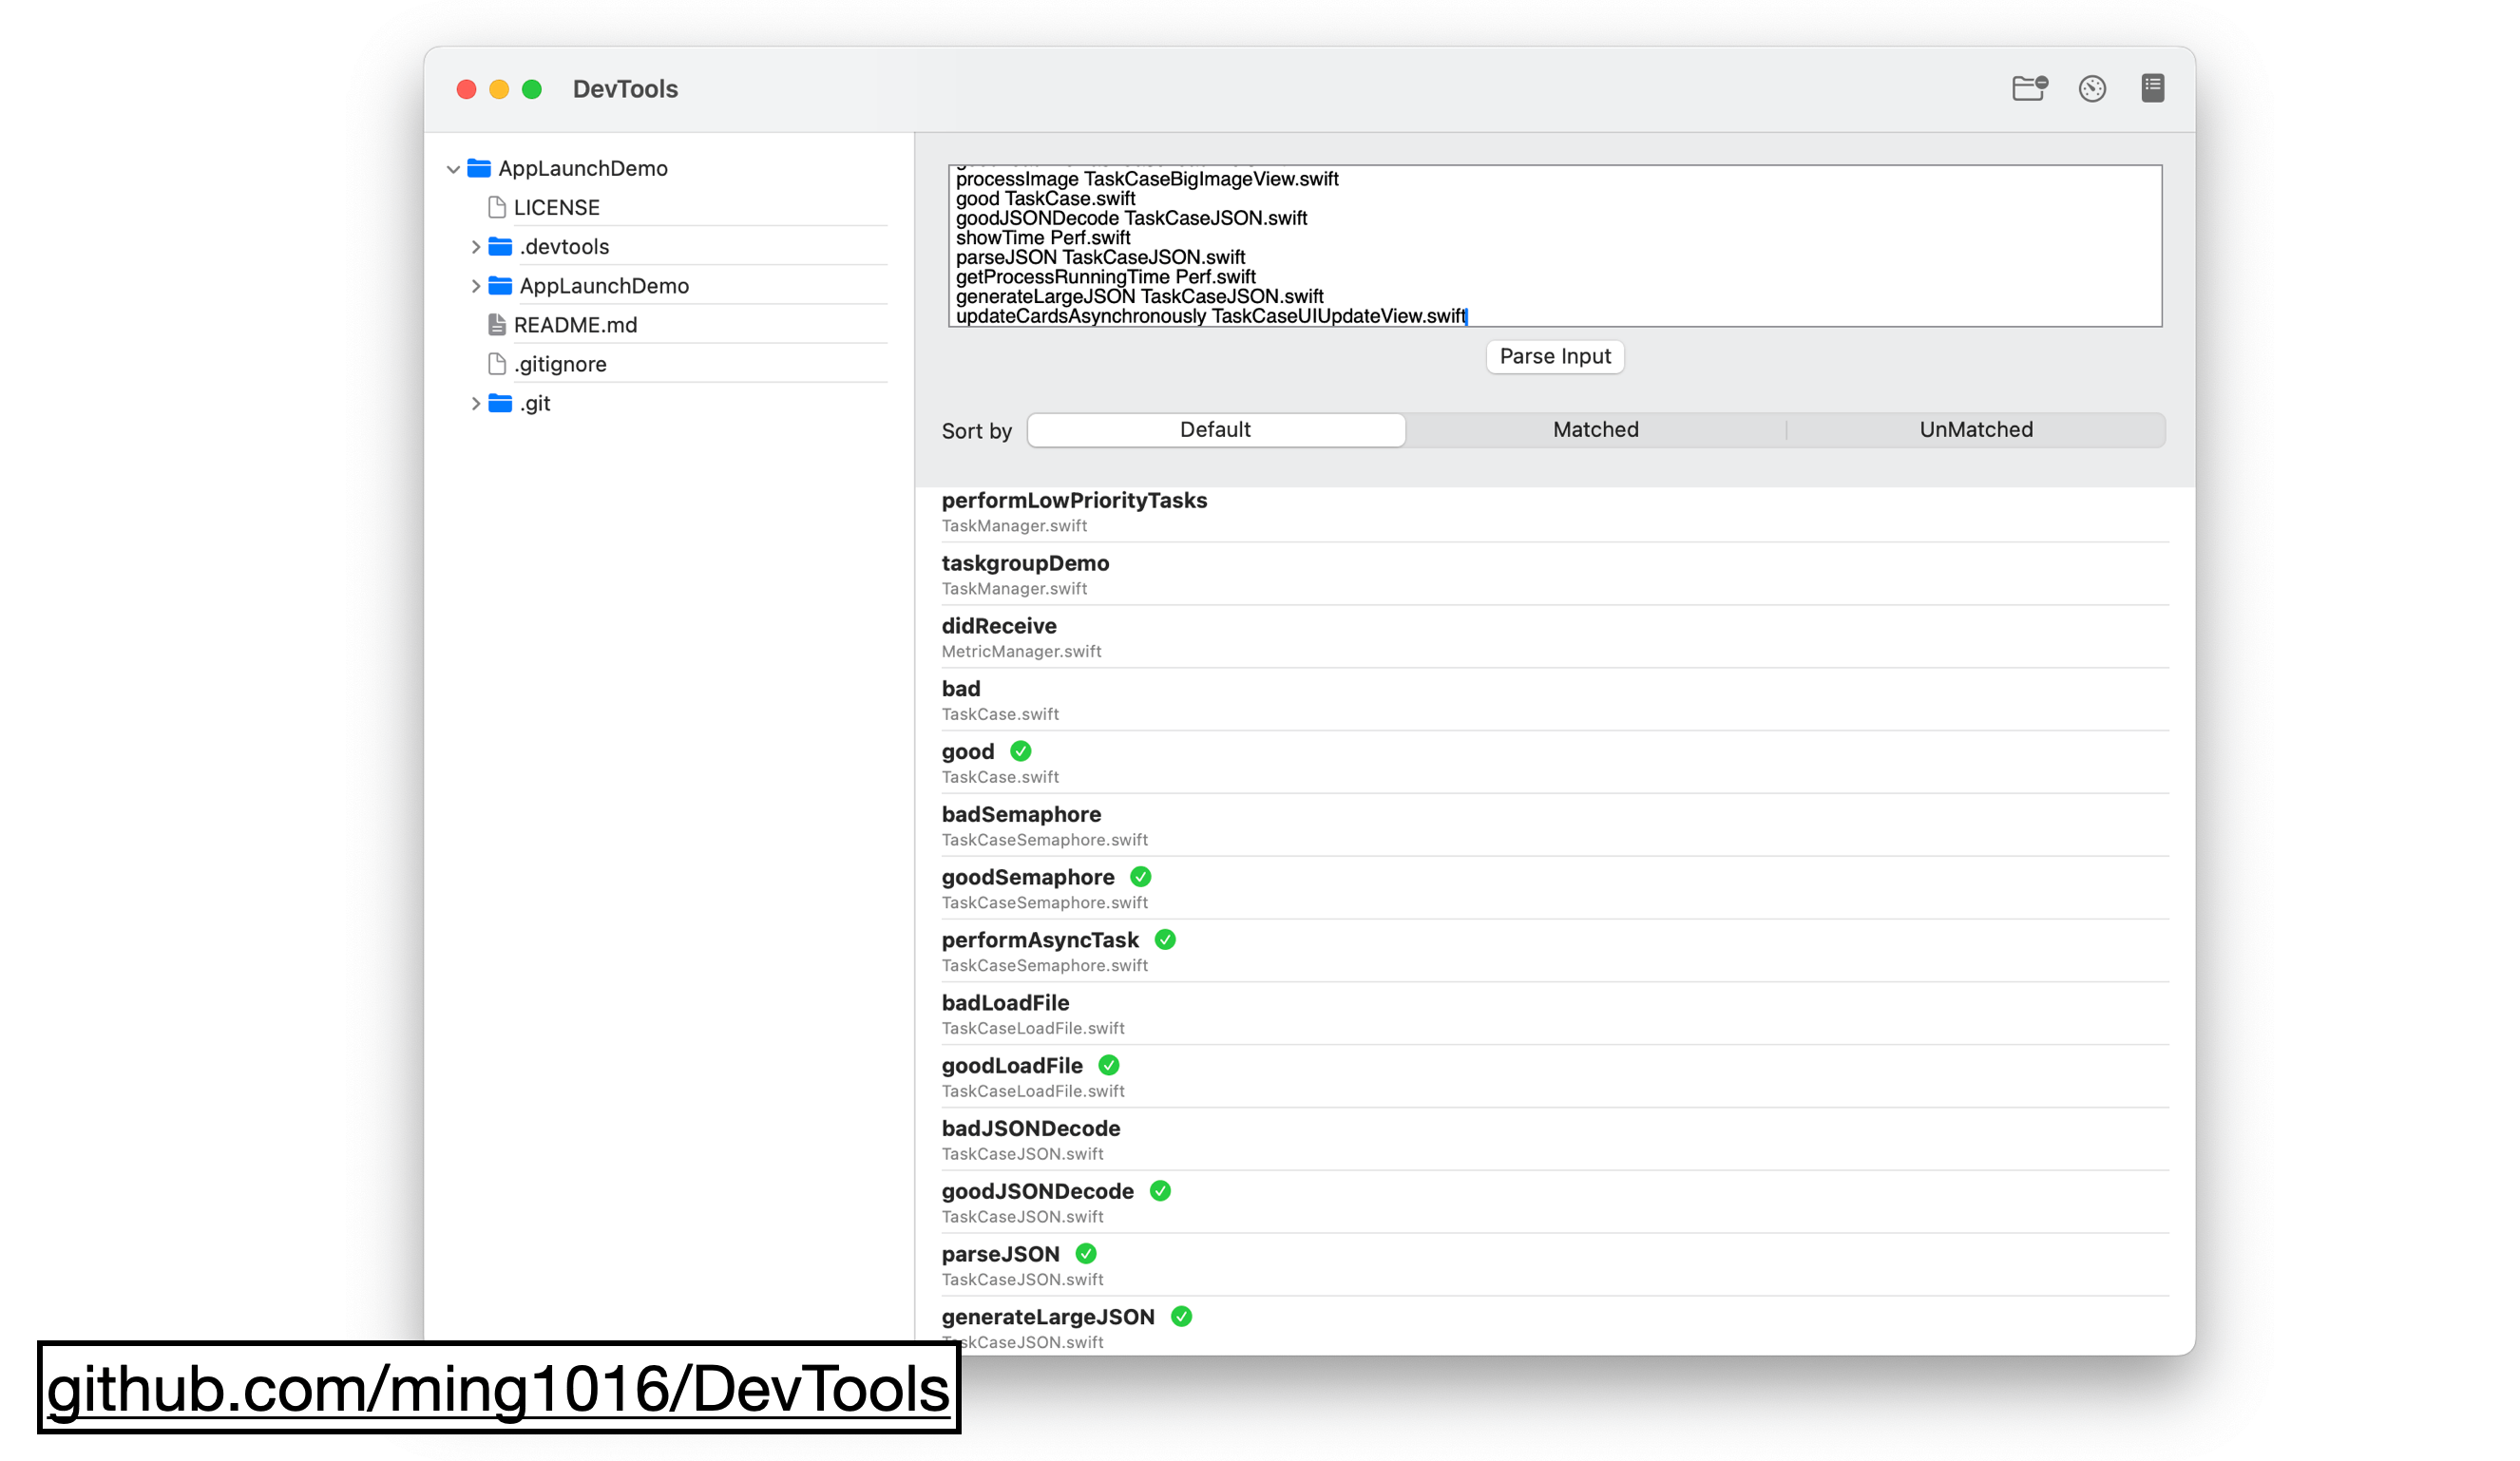
Click the button in the top-right corner of the tool, and it will show a list of all functions, with the ones that were executed marked.
We’ve gone over the built-in tools in Xcode for checking startup issues and how to create custom tools for automating the checks.
We also looked at some bad cases and discussed optimization techniques. To make every millisecond count, we shared more practical optimization tips.
I hope you found this helpful.
上面就是我分享的内容。另外这次主题是个大话题,还有很多相关知识可能需要花费更多时间学习,我也整理了些官方内容和一些工具。
- Guide
- WWDC Session
- Mergeable Libraries
- Tools
很多嘉宾的博客我都订阅过,看过他们很多的分享。
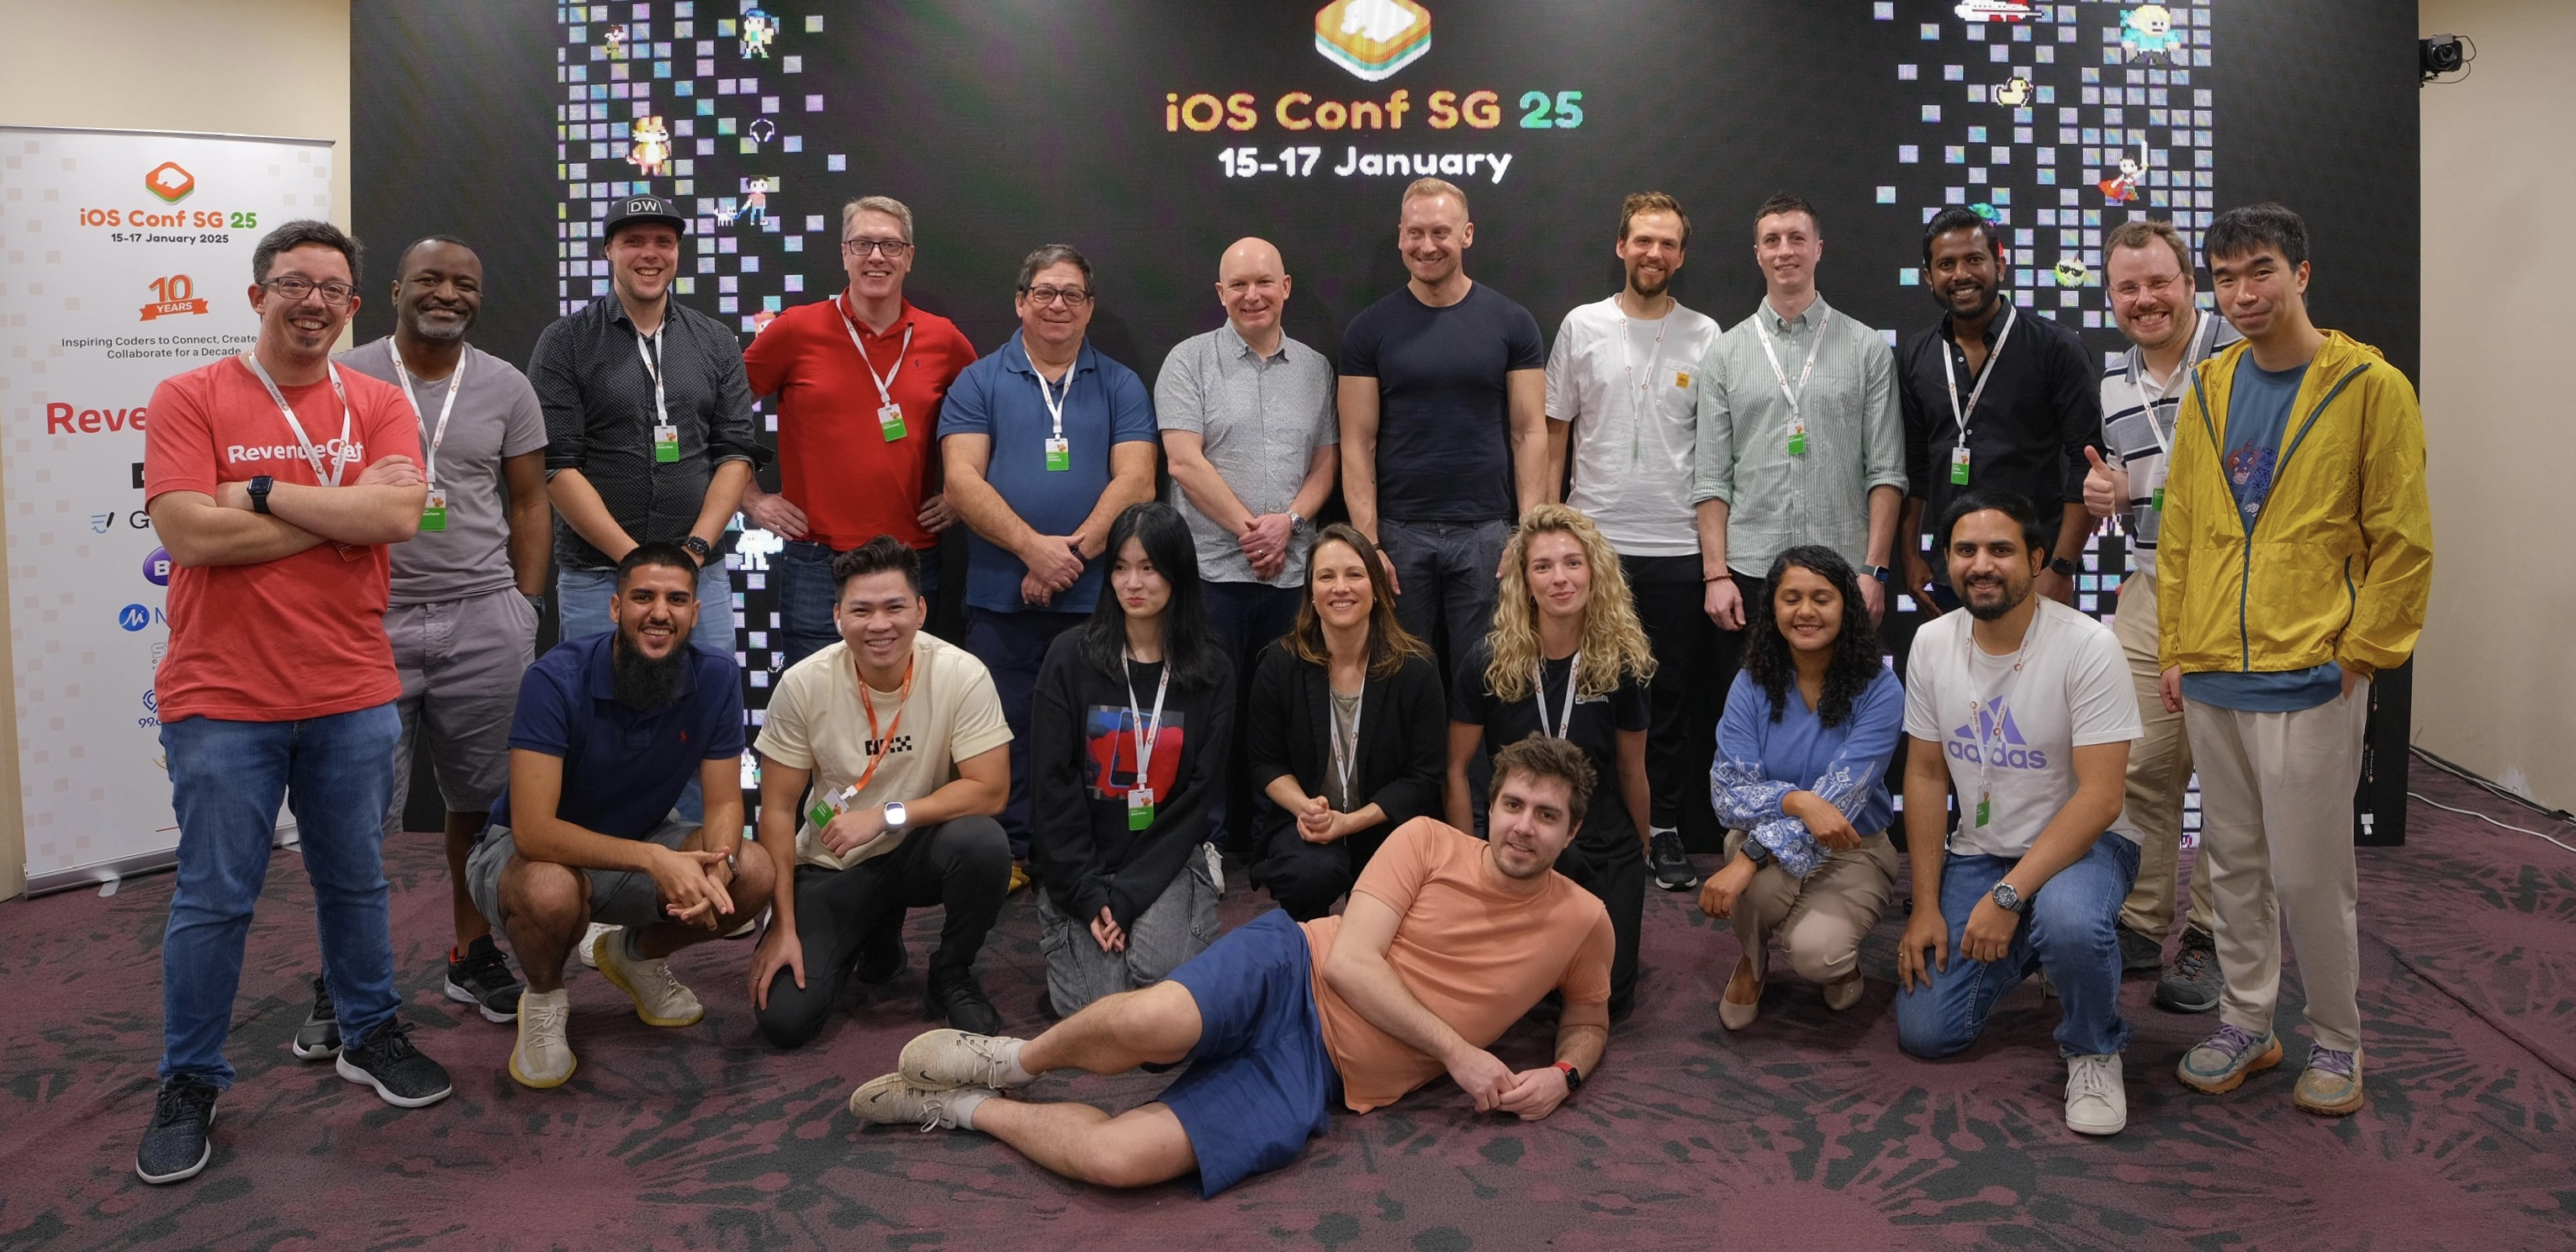
这次也是 iOS Conf SG 大会的10周年。很多上次 KWDC 大会认识的韩国朋友也来了。思琦说这次上海的 Let’s Vision 25 也会有很多有意思的国内外嘉宾过来,真是非常期待。